detectionPlotter
Create detection plotter
Description
detPlotter = detectionPlotter(tp)tp.
detPlotter = detectionPlotter(tp,Name,Value)Name,Value pair arguments.
Examples
Create a theater plot.
tp = theaterPlot('XLim',[0,90],'YLim',[-35,35],'ZLim',[1,10]);
Create a detection plotter with the name Radar Detections.
radarPlotter = detectionPlotter(tp,'DisplayName','Radar Detections');
Update the detection plotter with three detections labeled 'R1', 'R2', and 'R3' positioned in units of meters at , , and with corresponding velocities (in m/s) of , , and , respectively.
positions = [30, 5, 4; 30, -10, 2; 30, 15, 1];
velocities = [-10, 0, 2; -10, 3, 1; -10, -4, 1];
labels = {'R1','R2','R3'};
plotDetection(radarPlotter, positions, velocities, labels)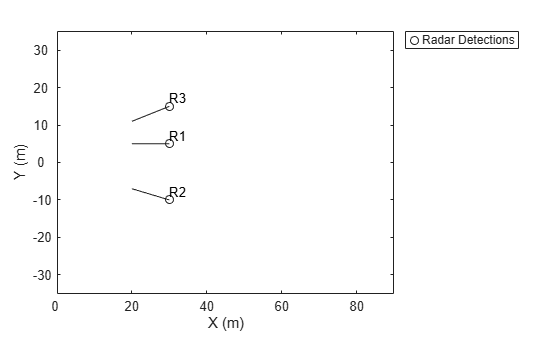
Input Arguments
Name-Value Arguments
Specify optional pairs of arguments as
Name1=Value1,...,NameN=ValueN, where Name is
the argument name and Value is the corresponding value.
Name-value arguments must appear after other arguments, but the order of the
pairs does not matter.
Before R2021a, use commas to separate each name and value, and enclose
Name in quotes.
Example: 'MarkerSize',10
Plot name to display in legend, specified as the comma-separated pair consisting of 'DisplayName' and a character vector or string scalar. If no name is specified, no entry is shown.
Example: 'DisplayName','Radar Detections'
Number of previous track updates to display, specified as the comma-separated pair
consisting of 'HistoryDepth' and a nonnegative integer less than or
equal to 10,000. If set to 0, then no previous updates are rendered.
Marker symbol, specified as the comma-separated pair consisting of
'Marker' and one of these symbols.
| Marker | Description | Resulting Marker |
|---|---|---|
"o" | Circle |
|
"+" | Plus sign |
|
"*" | Asterisk |
|
"." | Point |
|
"x" | Cross |
|
"_" | Horizontal line |
|
"|" | Vertical line |
|
"square" | Square |
|
"diamond" | Diamond |
|
"^" | Upward-pointing triangle |
|
"v" | Downward-pointing triangle |
|
">" | Right-pointing triangle |
|
"<" | Left-pointing triangle |
|
"pentagram" | Pentagram |
|
"hexagram" | Hexagram |
|
"none" | No markers | Not applicable |
Size of marker, specified as the comma-separated pair consisting of
'MarkerSize' and a positive integer in points.
Marker outline color, specified as the comma-separated pair consisting of
'MarkerEdgeColor' and a character vector, a string scalar, an
RGB triplet, or a hexadecimal color code.
Marker outline color, specified as the comma-separated pair consisting of
'MarkerFaceColor' and a character vector, a string scalar, an
RGB triplet, a hexadecimal color code, or 'none'. The default is
'none'.
Font size for labeling detections, specified as the comma-separated pair
consisting of 'FontSize' and a positive integer that represents
font point size.
Gap between label and positional point it annotates, specified as the
comma-separated pair consisting of 'LabelOffset' and a
three-element row vector. Specify the [x
y
z] offset in meters.
Scale factor for magnitude length of velocity vectors, specified as the
comma-separated pair consisting of 'VelocityScaling' and a
positive scalar. The plot renders the magnitude vector value as VK,
where V is the magnitude of the velocity in meters per second, and
K is the value of VelocityScaling.
Tag to associate with the plotter, specified as the comma-separated pair
consisting of 'Tag' and a character vector or string scalar. The
default value is 'PlotterN', where
N is an integer that corresponds to the Nth
plotter associated with the theaterPlot.
Tags provide a way to identify plotter objects, for example when searching using
findPlotter.