Monitor Data Value and Quality of OPC UA Nodes in Simulink
This example shows how to implement a dashboard showing instantaneous values and quality metrics related to specific OPC Unified Architecture (UA) nodes using Simulink® blocks from Industrial Communication Toolbox™.
You can read or write data to nodes on an OPC UA server using the OPC UA Read or OPC UA Write blocks in Simulink. This example uses an OPC UA Read block to read data from two nodes on an OPC UA server and a custom dashboard to monitor the node values and quality.
Prerequisites:
Set up an OPC UA server: To run this example in your MATLAB® session, you must install and start Prosys OPC UA Simulation Server. For more information, see Install an OPC UA Simulation Server for OPC UA Examples.
Configure an OPC UA client: To use the OPC UA Read block, you must connect at least one OPC UA client to an OPC UA server. For more information on how to create and connect an OPC UA client in Simulink, see Configure OPC UA Client in Simulink. For information on how to read data from nodes on an OPC UA server, see the example Get Started with OPC UA in Simulink.
Model Description
The image shows a model where an OPC UA Read block is configured to read the nodes named Counter and Sinusoid from an OPC UA server. The OPC UA Read block outputs the node values as a Simulink bus at its Value port. A Bus Selector (Simulink) block is used to demux the Simulink bus and obtain the values of individual nodes. To display the values of individual nodes, Scope blocks are attached to the outputs of the Bus Selector block. You can view the timestamp and quality of the data at the nodes by using a Display block.
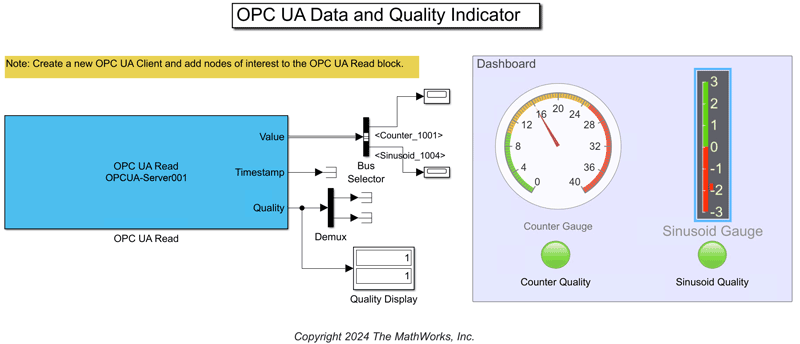
Dashboard
Gauges to Monitor Node Values
The DataValueAndQualityIndicator model provided with this example contains a Circular Gauge (Simulink) block labeled Counter Gauge and a Vertical Gauge (Simulink) block labeled Sinusoid Gauge to monitor the node values. This example reads from two nodes named Counter and Sinusoid whose values range from 0 to 30 and 2 to 2, respectively. You can customize the scale, needle, and color scheme of the Gauge blocks. For this example, the Circular Gauge block is customized to display values ranging from 0 to 40, and the Vertical Gauge block is customized to display negative values in red and positive values in green.
Lamps to Monitor Node Data Quality
The OPC UA Read block outputs the quality of read data as Boolean values. This example reads from two nodes named Counter and Sinusoid whose quality values are monitored using Lamp (Simulink) blocks labeled as Counter Quality and Sinusoid Quality, respectively. For this example, the lamps turn green when data quality is Good and red when data quality is Bad or Uncertain. For more information, refer to Quality.
Extend the Example
This example uses Prosys OPC UA Simulation Server configured with two nodes. You can read the value and quality of node data available on any accessible OPC UA server using the OPC UA Read block. You can monitor the read data using the dashboard blocks available in the Simulink Dashboard library. You can customize the dashboard blocks based on your use case and display requirements.