plotSFR
Plot spatial frequency response of edge
Description
plotSFR(
plots
the spatial frequency response (SFR) in a sharpness measurement table or aggregate
sharpness measurement table.sharpnessMeasurementTable
)
plotSFR(
plots the SFR, specifying additional parameters to control aspects of the
display.sharpnessMeasurementTable
,Name,Value
)
Examples
Plot Spatial Frequency Response of Specific ROIs from an eSFR Chart
This example shows how to display the spatial frequency response (SFR) plot of a specified subset of the 60 slanted edge ROIs on an Imatest® eSFR chart.
Read an image of an eSFR chart into the workspace.
I = imread("eSFRTestImage.jpg");
Create an esfrChart
object, then display the chart with ROI annotations. The 60 slanted edge ROIs are labeled with green numbers.
chart = esfrChart(I);
displayChart(chart,displayGrayROIs=false,...
displayColorROIs=false,displayRegistrationPoints=false)
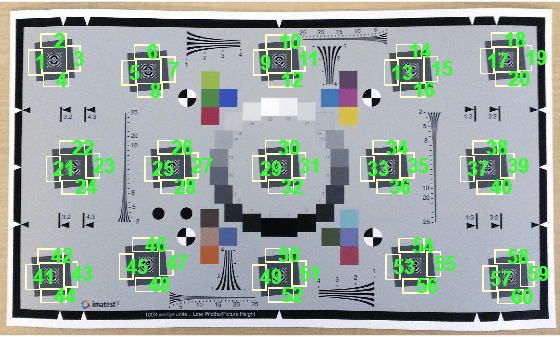
Measure the edge sharpness in all ROIs and return the measurements in sharpnessTable
.
sharpnessTable = measureSharpness(chart);
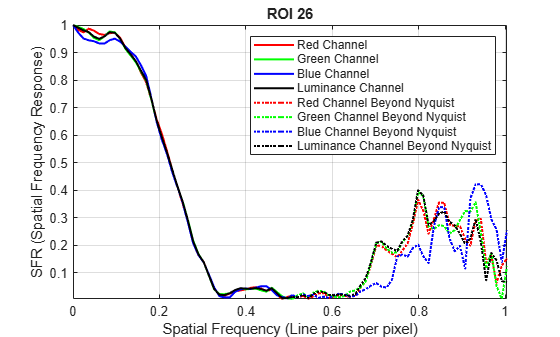
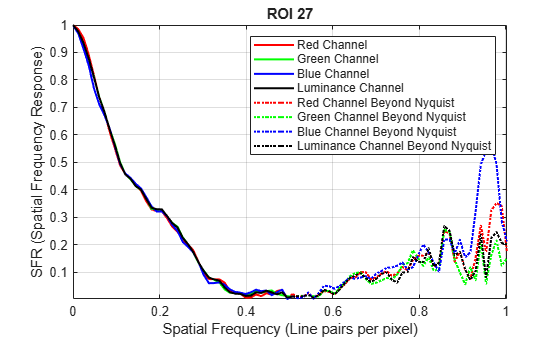
Display the SFR plot of ROIs 26 and 27 only.
plotSFR(sharpnessTable,ROIIndex=[26 27]);
Input Arguments
sharpnessMeasurementTable
— SFR measurements
sharpness table | aggregate sharpness table
SFR measurements of edges, specified as a sharpness table or aggregate sharpness table with m rows:
When
sharpnessMeasurementTable
is a sharpness table, m is the number of sampled ROIs.When
sharpnessMeasurementTable
is an aggregate sharpness table, m is either 1 or 2, corresponding to the number of sampled orientations.
To obtain a sharpness table or aggregate sharpness table, use the
measureSharpness
function.
Data Types: table
Name-Value Arguments
Specify optional pairs of arguments as
Name1=Value1,...,NameN=ValueN
, where Name
is
the argument name and Value
is the corresponding value.
Name-value arguments must appear after other arguments, but the order of the
pairs does not matter.
Before R2021a, use commas to separate each name and value, and enclose
Name
in quotes.
Example: plotSFR(myTable,'ROIIndex',2)
displays the measured
sharpness only of ROI 2.
ROIIndex
— ROI indices
scalar | vector
ROI indices to display, specified as the comma-separated pair
consisting of 'ROIIndex'
and a scalar or vector of
integers in the range [1, 60]. The indices match the ROI numbers
displayed by displayChart
.
When
sharpnessMeasurementTable
is a sharpness table, by defaultplotSFR
creates only one figure, showing the SFR plot from the first row of the table.When
sharpnessMeasurementTable
is an aggregate sharpness table,plotSFR
ignores the specifiedROIIndex
, and creates one figure for each row in the table.
Example: 29:32
Data Types: single
| double
| int8
| int16
| int32
| uint8
| uint16
| uint32
displayLegend
— Display plot legend
true
(default) | false
Display plot legend, specified as the comma-separated pair consisting
of 'displayLegend'
and true
or
false
. When displayLegend
is
true
, the SFR plot shows a legend that identifies
the different curves on the plot.
Data Types: logical
displayTitle
— Display plot title
true
(default) | false
Display plot title, specified as the comma-separated pair consisting
of 'displayTitle'
and true
or
false
. When displayTitle
is
true
, the SFR plot shows a title that indicates
the individual ROI index or aggregate ROI orientation.
Data Types: logical
Parent
— Axes handle of displayed image object
axes handle
Axes handle of the displayed image object, specified as the
comma-separated pair consisting of 'Parent'
and an
axes handle. Parent
specifies the parent of the
image object created by plotSFR
.
Version History
Introduced in R2017b
Ouvrir l'exemple
Vous possédez une version modifiée de cet exemple. Souhaitez-vous ouvrir cet exemple avec vos modifications ?
Commande MATLAB
Vous avez cliqué sur un lien qui correspond à cette commande MATLAB :
Pour exécuter la commande, saisissez-la dans la fenêtre de commande de MATLAB. Les navigateurs web ne supportent pas les commandes MATLAB.
Select a Web Site
Choose a web site to get translated content where available and see local events and offers. Based on your location, we recommend that you select: .
You can also select a web site from the following list:
How to Get Best Site Performance
Select the China site (in Chinese or English) for best site performance. Other MathWorks country sites are not optimized for visits from your location.
Americas
- América Latina (Español)
- Canada (English)
- United States (English)
Europe
- Belgium (English)
- Denmark (English)
- Deutschland (Deutsch)
- España (Español)
- Finland (English)
- France (Français)
- Ireland (English)
- Italia (Italiano)
- Luxembourg (English)
- Netherlands (English)
- Norway (English)
- Österreich (Deutsch)
- Portugal (English)
- Sweden (English)
- Switzerland
- United Kingdom (English)