geoiconchart
Syntax
Description
Vector Data
geoiconchart(
displays pushpin icons at the specified latitude and longitude coordinates. Specify the
latitudes using lat,lon)lat and the longitudes using
lon. If the current axes is not a geographic or map axes, or if there
is no current axes, then the function creates the icon chart in a new geographic
axes.
Table Data
Additional Options
geoiconchart( displays
the icons in the geographic axes or map axes specified by ax,___)ax. Specify
the axes as the first argument in any of the previous syntaxes.
geoiconchart(___,
specifies properties of the geographic icon chart using one or more name-value arguments.
For a list of properties, see IconChart Properties.Name=Value)
returns
the ic = geoiconchart(___)IconChart object. Use ic to set properties after
creating the chart. For a full list of properties, see IconChart Properties.
Examples
Read the latitude and longitude coordinates of European capitals into the workspace. Display the coordinates on a map by creating an icon chart. By default, the icon chart uses pushpin icons.
[lat,lon] = readvars("european_capitals.txt");
geoiconchart(lat,lon)Zoom out by changing the geographic limits. Add a title.
geolimits([35.5 56],[-13 35])
title("European Capitals")![]()
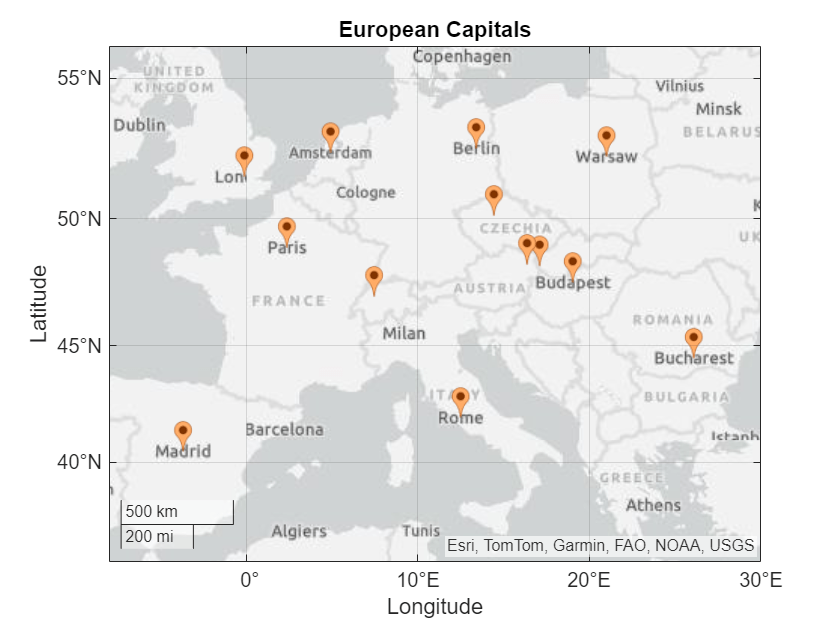
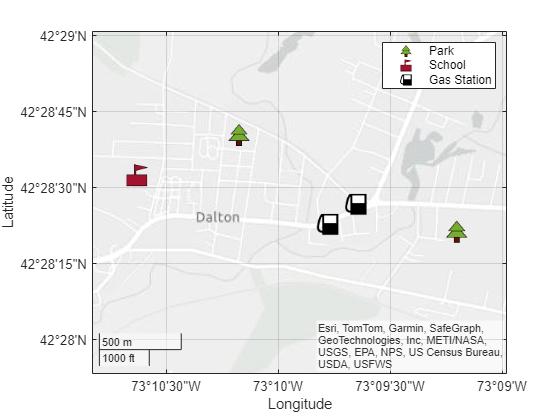
Specify the latitude and longitude coordinates of two parks, a school, and two gas stations.
parkLat = [42.4779 42.4726]; parkLon = [-73.1696 -73.1534]; schoolLat = 42.4757; schoolLon = -73.1772; gasLat = [42.4741 42.473]; gasLon = [-73.1609 -73.163];
Display the coordinates on a map by creating three icon charts. Use a different icon for each chart by specifying the names of image files. Prepare to add a legend by specifying a display name for each chart.
figure geoiconchart(parkLat,parkLon,"park.png",DisplayName="Park") hold on geoiconchart(schoolLat,schoolLon,"school.png",DisplayName="School") geoiconchart(gasLat,gasLon,"gas-station.png",DisplayName="Gas Station")
Zoom out by changing the geographic limits. Add a legend.
geolimits([42.4647 42.4837],[-73.1845 -73.1457]) legend
![]()
Read point data in geographic coordinates from a GPX file into a geospatial table. Extract the latitude and longitude coordinates from the table.
GT = readgeotable("shibuya_track.gpx",Layer="track_points"); lat = GT.Shape.Latitude; lon = GT.Shape.Longitude;
Create an icon chart using icons with different sizes. The SizeData argument specifies the height of each icon in points.
numPoints = length(lat); sz = linspace(20,60,numPoints); figure geoiconchart(lat,lon,SizeData=sz)
Zoom out by changing the geographic limits.
geolimits([35.65694 35.66096],[139.69491 139.70240])
![]()
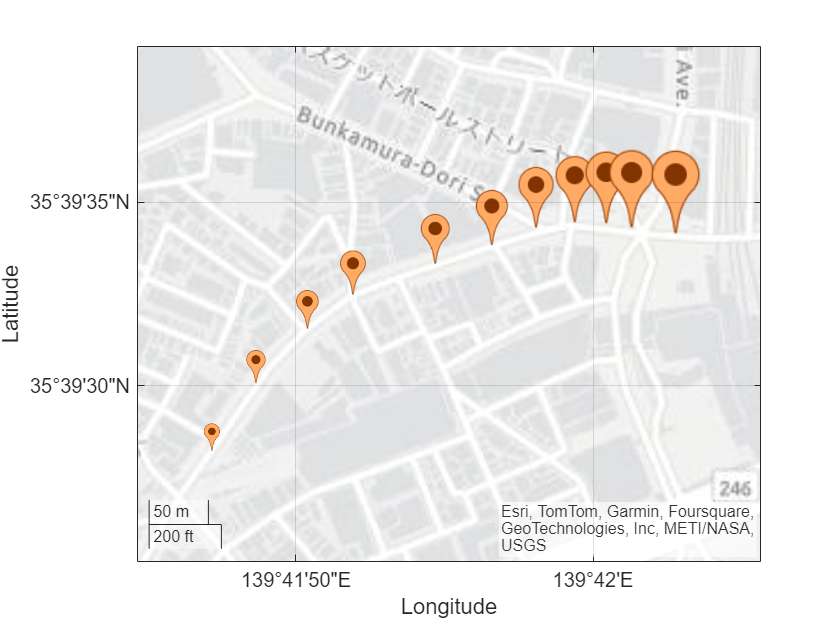
Corresponding elements in the latitude, longitude, and size vectors determine the location and size of each icon. To display all the icons using the same size, specify the size using a numeric scalar.
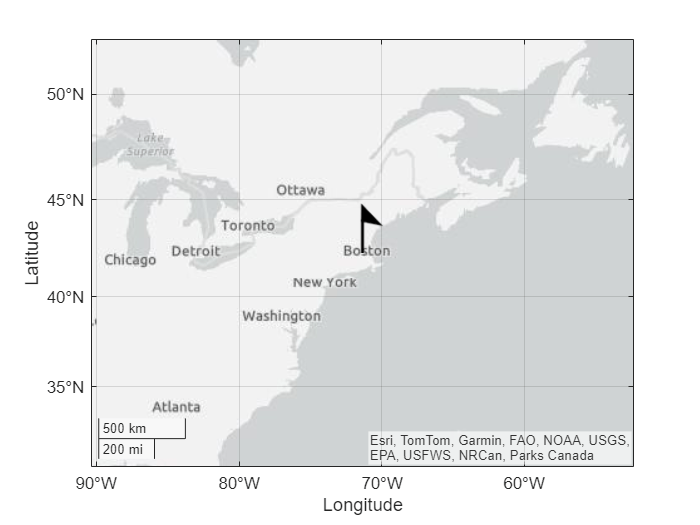
Display a wind barb icon on a map. Prepare to change properties of the icon by returning the IconChart object in ic.
figure
ic = geoiconchart(42.3,-71.35,"wind-barb.png",SizeData=40);When you change the rotation angle of an icon, the icon rotates around the anchor point. For custom icons, the default anchor point is the center of the icon. Change the anchor point to the bottom-center edge of the icon.
ic.IconAnchorPoint = "bottom";Using a loop, rotate the icon around its base. As the rotation angle increases, the icon rotates in a counterclockwise direction.
for r = 0:5:360 ic.IconRotation = r; drawnow end
![]()
Read a spreadsheet containing tsunami events into the workspace as a table. The table stores the coordinates of the tsunami events in the Latitude and Longitude variables, and the causes of the tsunami events in the Cause variable.
tsunamis = readtable("tsunamis.xlsx",TextType="string");
Create a subtable of tsunami events that were caused by volcanoes.
idx = contains(tsunamis.Cause,"Volcano");
volcano = tsunamis(idx,:);Create an icon chart from the table. Pass the table to the geoiconchart function, followed by the variables that contain the latitude and longitude coordinates.
geoiconchart(volcano,"Latitude","Longitude","volcano.png")
Zoom out by changing the geographic limits. Add a title.
geolimits([-68 81],[-180 180])
title("Tsunami Events Caused by Volcanoes")
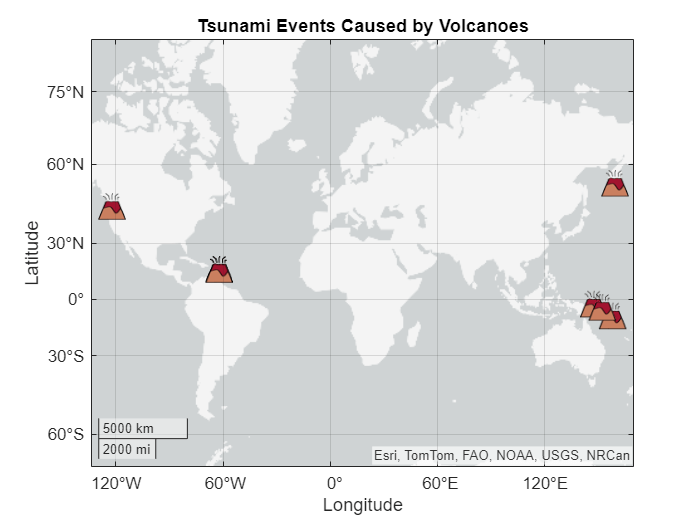
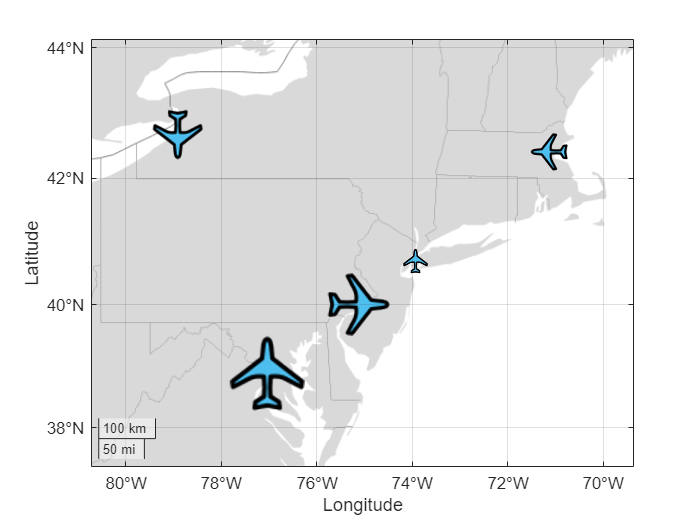
One way to use custom icon sizes and rotation angles when creating an icon chart from a table is to set the SizeVariable and IconRotationVariable properties of the chart.
Create a geospatial table by geocoding the names of several American cities. The geospatial table represents the cities using point shapes in geographic coordinates. Get the latitude and longitude coordinates from the point shapes by converting the geospatial table into a table with Latitude and Longitude variables. Then, add table variables that contain linearly-spaced sizes and angles.
GT = geocode(["New York","Boston","Buffalo","Philadelphia","Washington D.C."],"city"); T = geotable2table(GT,["Latitude","Longitude"]); T.Size = linspace(20,60,height(T))'; T.Angle = linspace(0,360,height(T))'
T=5×6 table
Name AdminLevel Latitude Longitude Size Angle
_________________ __________ ________ _________ ____ _____
"New York" "city" 40.697 -73.93 20 0
"Boston" "city" 42.41 -71.13 30 90
"Buffalo" "city" 42.676 -78.908 40 180
"Philadelphia" "city" 40.006 -75.117 50 270
"Washington D.C." "city" 38.891 -77.034 60 360
Create an icon chart from the table. Pass the table to the geoiconchart function, followed by the variables that contain the latitude and longitude coordinates. Change the sizes of the icons by specifying the SizeVariable property. Change the rotation angles of the icons by specifying the IconRotationVariable property.
figure geobasemap grayland geoiconchart(T,"Latitude","Longitude","airplane.png", ... SizeVariable="Size",IconRotationVariable="Angle")
Zoom out by changing the geographic limits.
geolimits([37.35 44.13],[-82.14 -67.94])
![]()
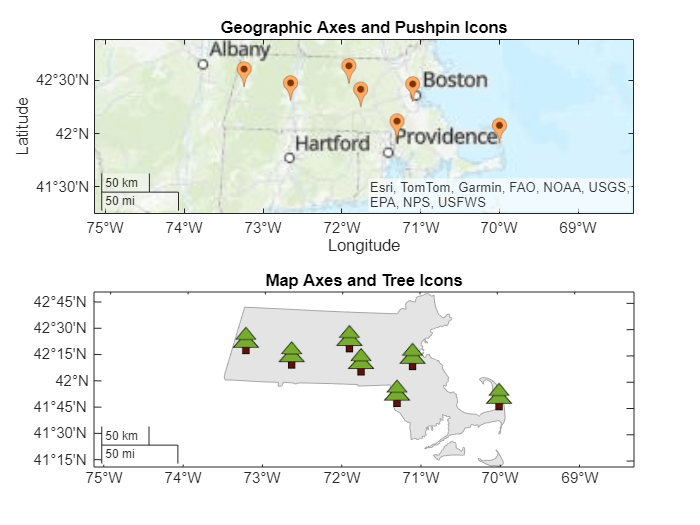
Create multiple maps in a single figure by using a tiled chart layout.
Specify the latitude and longitude coordinates of several wildlife sanctuaries in Massachusetts.
lat = [42.3 42.24 42.43 42.29 42.46 41.94 41.9]; lon = [-72.65 -71.76 -73.24 -71.1 -71.91 -71.3 -70];
Create a 2-by-1 tiled chart layout.
figure t = tiledlayout(1,2);
Place a geographic axes in the first tile. Display the sanctuaries in the geographic axes by using pushpin icons.
gx = geoaxes(t); geobasemap(gx,"topographic") geoiconchart(gx,lat,lon) title(gx,"Geographic Axes and Pushpin Icons")
Place a map axes in the second tile. Specify the projected coordinate reference system (CRS) for the map axes using the EPSG code 26986, which uses a Lambert Conformal Conic projection method.
nexttile pcrs = projcrs(26986); mx = newmap(pcrs);
Add a simple basemap to the map axes by reading and plotting an area of interest (AOI) for the state of Massachusetts. Then, display the sanctuaries in the map axes by using a custom icon.
state = geocode("Massachusetts"); geoplot(mx,state,FaceColor=[0.7 0.7 0.7],EdgeColor=[0.65 0.65 0.65]) hold on geoiconchart(mx,lat,lon,"park.png") title(mx,"Map Axes and Tree Icons")
Apply matching geographic limits to the geographic axes and map axes. To get the limits, first buffer the AOI by 0.3 degrees. Then, find the bounds of the buffered AOI.
buffered = buffer(state.Shape,0.3); [latlim,lonlim] = bounds(buffered); geolimits(gx,latlim,lonlim) geolimits(mx,latlim,lonlim)
Remove the grid from the geographic axes and the graticule from the map axes.
grid(gx,"off") mx.GraticuleLineStyle = "none";

Input Arguments
Latitude coordinates in degrees, specified as a vector with elements in the range
[–90, 90]. The vector can contain NaN values.
The sizes of lat and lon must
match.
Data Types: single | double
Longitude coordinates in degrees, specified as a vector. The vector can contain
NaN values.
The sizes of lat and lon must
match.
Data Types: single | double
Name of the icon file, specified as a string scalar or a character vector. The
geoiconchart function supports most formats supported by the
imread function.
The icon file must satisfy these requirements:
The height and width of the icon must be equal.
The height and width of the icon must each be less than or equal to 256 pixels.
The way you specify the file depends on the location of the file.
If the file is in your current folder or in a folder on the MATLAB® path, then specify the name of the file, such as
"myIcon.png".If the file is not in your current folder or in a folder on the MATLAB path, then specify the full or relative pathname, such as
"C:\myfolder\myIcon.png"or"dataDir\myIcon.png".
Source table containing the data to plot, specified as a table or a timetable.
Table variable containing the latitude coordinates, specified using one of these indexing schemes.
| Indexing Scheme | Examples |
|---|---|
Variable name:
|
|
Variable index:
|
|
Variable type:
|
|
For geographic axes, regardless of the variable name, the axis label is always
Latitude.
The variable you specify must contain numeric data of type single
or double. The data must be in the range [–90, 90].
Example: geoiconchart(tbl,"lat","lon") specifies the table
variable named lat for the latitude coordinates.
Example: geoiconchart(tbl,2,"lon") specifies the second table
variable for the latitude coordinates.
Table variable containing the longitude coordinates, specified using one of these indexing schemes.
| Indexing Scheme | Examples |
|---|---|
Variable name:
|
|
Variable index:
|
|
Variable type:
|
|
For geographic axes, regardless of the variable name, the axis label is always
Longitude.
The variable you specify must contain numeric data of type single
or double.
Example: geoiconchart(tbl,"lat","lon") specifies the table
variable named lon for the longitude coordinates.
Example: geoiconchart(tbl,"lat",2) specifies the second table
variable for the longitude coordinates.
Target axes, specified as a GeographicAxes object1
or MapAxes object.
If you do not specify this argument, then the geoiconchart
function plots into the current axes, provided that the current axes is a geographic or
map axes object.
You can modify the appearance and behavior of a GeographicAxes
object or MapAxes object by setting its properties. For a list of
properties, see GeographicAxes Properties or MapAxes Properties.
Name-Value Arguments
Specify optional pairs of arguments as
Name1=Value1,...,NameN=ValueN, where Name is
the argument name and Value is the corresponding value.
Name-value arguments must appear after other arguments, but the order of the
pairs does not matter.
Example: geoiconchart(lat,lon,filename,IconAnchorPoint="top") sets the
anchor point to the top-center edge of the icon.
Note
Use name-value arguments to specify values for the properties of the
IconChart object created by this function. The properties listed here
are only a subset. For a full list, see IconChart Properties.
Icon heights, specified using one of these forms:
Positive scalar — Use the same height for all of the icons.
Vector of positive scalars — Use a different height for each icon. The size of the vector must match the number of data points. The vector can contain
NaNvalues.
Specify the values in point units, where one point equals 1/72 inch. To specify an
icon that has a height of one inch, use a value of 72. You can also specify
NaN values.
Location of the anchor point for the icon, specified as one of the values in this table. The coordinates of the anchor point correspond to the latitude and longitude coordinates that you pass to the geoiconchart function.
| Value | Description |
|---|---|
"center" | Center of the icon |
"topright" | Top-right corner of the icon |
"right" | Right-center edge of the icon |
"bottomright" | Bottom-right corner of the icon |
"bottom" | Bottom-center edge of the icon |
"bottomleft" | Bottom-left corner of the icon |
"left" | Left-center edge of the icon |
"topleft" | Top-left corner of the icon |
"top" | Top-center edge of the icon |
When you create the icon chart using the default pushpin icon, the default anchor point is
"bottom". When you create the icon chart by specifying the name
of an icon file, the default anchor point is "center".
Icon rotation angle, in degrees, specified using one of these forms:
Numeric scalar — Use the same rotation angle for all of the icons.
Numeric vector — Use a different rotation angle for each icon. The size of the vector must match the number of data points.
The icon rotates around the anchor point specified by the IconAnchorPoint property.
Positive values rotate the icon counterclockwise. Negative values rotate the icon clockwise.
Icon colors, specified as an n-by-n-by-3 array of RGB triplets. The value of n must be less than or equal to 256.
Each RGB triplet defines a color for one pixel of the icon. An RGB triplet is a three-element vector that specifies the intensities of the red, green and blue components of the color. The first page of the array contains the red components, the second page contains the green components, and the third page contains the blue components.
The interpretation of IconColorData depends on the data type of the array.
If
IconColorDatais of typedoubleorsingle, then an RGB triplet value of[0 0 0]corresponds to black and[1 1 1]corresponds to white.If
IconColorDatais an integer type, then the icon uses the full range of data to determine the color. For example, ifIconColorDatais of typeuint8, then[0 0 0]corresponds to black and[255 255 255]corresponds to white. IfIconColorDatais of typeint8, then[-128 -128 -128]corresponds to black and[127 127 127]corresponds to white.
When the value of IconAlphaData is not
scalar, the sizes of IconColorData and
IconAlphaData must be consistent.
For more information about changing the color of an icon, see Control Color and Transparency of Icon Chart.
Icon transparency, specified as one of these options:
A scalar — Use a consistent transparency across the entire icon.
An n-by-n matrix — Each value defines the transparency for one pixel of the icon. The value of n must be less than or equal to 256. The size of the matrix must be consistent with the size of the first two dimensions of
IconColorData.
The interpretation of IconAlphaData depends on the data type:
If
IconAlphaDatais of typedoubleorsingle, then0is completely transparent and1is opaque. Values between0and1are semitransparent.If
IconAlphaDatais an integer type, then the icon uses the full range of data to determine the transparency. For example, ifIconAlphaDatais of typeint8, then-128is completely transparent and127is opaque. Values between-128and127are semitransparent.
For more information about changing the transparency of an icon, see Control Color and Transparency of Icon Chart.
Output Arguments
Icon chart, returned as an IconChart object. Use
ic to modify the properties of an icon chart after you create it.
For a full list of properties, see IconChart Properties.
Tips
When you plot on geographic axes, the
geoiconchartfunction assumes that coordinates are referenced to the WGS84 coordinate reference system. If you plot using coordinates that are referenced to a different coordinate reference system, then the coordinates might appear misaligned.
Version History
Introduced in R2024b
See Also
Functions
Properties
1 Alignment of boundaries and region labels are a presentation of the feature provided by the data vendors and do not imply endorsement by MathWorks®.
MATLAB Command
You clicked a link that corresponds to this MATLAB command:
Run the command by entering it in the MATLAB Command Window. Web browsers do not support MATLAB commands.
Sélectionner un site web
Choisissez un site web pour accéder au contenu traduit dans votre langue (lorsqu'il est disponible) et voir les événements et les offres locales. D’après votre position, nous vous recommandons de sélectionner la région suivante : .
Vous pouvez également sélectionner un site web dans la liste suivante :
Comment optimiser les performances du site
Pour optimiser les performances du site, sélectionnez la région Chine (en chinois ou en anglais). Les sites de MathWorks pour les autres pays ne sont pas optimisés pour les visites provenant de votre région.
Amériques
- América Latina (Español)
- Canada (English)
- United States (English)
Europe
- Belgium (English)
- Denmark (English)
- Deutschland (Deutsch)
- España (Español)
- Finland (English)
- France (Français)
- Ireland (English)
- Italia (Italiano)
- Luxembourg (English)
- Netherlands (English)
- Norway (English)
- Österreich (Deutsch)
- Portugal (English)
- Sweden (English)
- Switzerland
- United Kingdom (English)