Main Content

tightPosition

Position of axes plotting area

Since R2022b

    Description

    pos = tightPosition(ax) returns the position of the rectangle that circumscribes the plotting area of the axes ax. The result is a four-element vector of the form [left bottom width height] that describes the position and size of the rectangle in the units specified in the Units property of the axes object. By default, the units are normalized values between 0 and 1.

    example

    pos = tightPosition(ax,Name=Value) returns the position of the rectangle based on the settings of one or more name-value arguments. For example, tightPosition(ax,IncludeLabels=true) returns the position of the rectangle that surrounds the title, subtitle, tick labels, and axis labels of ax.

    example

    Examples

    collapse all

    Plot a spiral. Use the axis function to adjust the plot box so that the x- and y-scales are equal and so that the plot box surrounds the spiral tightly.

    t = linspace(0,10,100);
    ax = axes;
    plot(t.*sin(t),t.*cos(t))
    axis equal tight

    Figure contains an axes object. The axes object contains an object of type line.

    Get the position vector, and use that vector to draw a red rectangle that circumscribes the plotting area. For Cartesian axes, the plotting area is the area inside the plot box. This rectangle is coincident with the plot box.

    pos = tightPosition(ax);
    annotation("rectangle",pos,Color="red",LineWidth=2)

    Figure contains an axes object. The axes object contains an object of type line.

    Get the position vector that includes the axis tick labels, and use that vector to draw a blue rectangle around the plot box and the tick labels.

    poslab = tightPosition(ax,IncludeLabels=true);
    annotation("rectangle",poslab,Color="blue",LineWidth=2)

    Figure contains an axes object. The axes object contains an object of type line.

    Load the mri data set and display the MRI image stored in the D variable. Use the axis function to preserve the aspect ratio of the image.

    figure
    ax = axes;
    load mri
    image(D(:,:,10))
    axis image

    Figure contains an axes object. The axes object contains an object of type image.

    Get the position vector, and use that vector to draw a red rectangle that circumscribes the plotting (image) area. For Cartesian axes, the plotting area is the area inside the plot box. This rectangle is coincident with the plot box.

    pos = tightPosition(ax);
    annotation("rectangle",pos,Color="red",LineWidth=2)

    Figure contains an axes object. The axes object contains an object of type image.

    Get the position vector that includes the axis tick labels, and use that vector to draw a blue rectangle around the plot box and the tick labels.

    poslab = tightPosition(ax,IncludeLabels=true);
    annotation("rectangle",poslab,Color="blue",LineWidth=2)

    Figure contains an axes object. The axes object contains an object of type image.

    Define a function positionAx2 that takes two sets of axes as arguments. The function sets the position of the second set of axes so that it is directly to the right of the first set. The function also sets the width of the second set of axes as a constant 100 pixels.

    function positionAx2(ax,ax2)
      tp = tightPosition(ax,Units="Pixels");
      ax2.Position(1) = tp(1) + tp(3);
      ax2.Position(3) = 100;
      ax2.Position([2 4]) = tp([2 4]);
    end

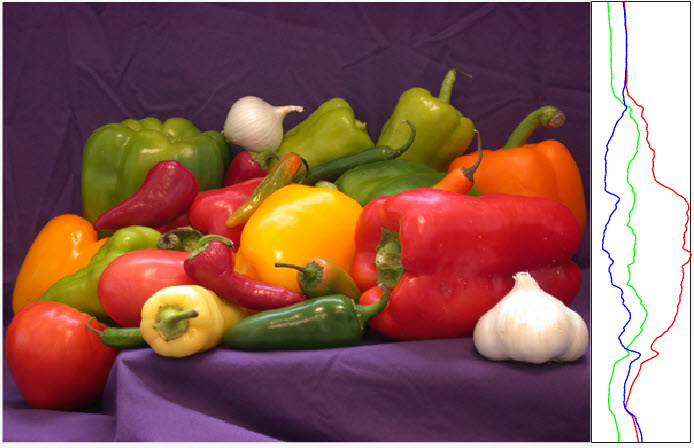
    Display an image. To the right of the image, plot the sum of the RGB values of each corresponding row of pixels of the image. Set the SizeChangedFcn property of the figure to a function handle for positionAx2. When you resize the figure, the line plot maintains its position relative to the image and its 100-pixel width.

    f = figure;
    ax = axes(f);
    im = imread("peppers.png");
    image(ax,im)
    axis(ax,"image","off")
    
    ax2 = axes(f,Units="Pixels");
    hold(ax2,"on")
    plot(ax2,sum(im(:,:,1),2),"r",LineWidth=1)
    plot(ax2,sum(im(:,:,2),2),"g",LineWidth=1)
    plot(ax2,sum(im(:,:,3),2),"b",LineWidth=1)
    view(ax2,[90 90])
    box(ax2,"on")
    xticks(ax2,[])
    yticks(ax2,[])
    xlim(ax2,"tight")
    
    f.SizeChangedFcn = @(~,~)positionAx2(ax,ax2);
    positionAx2(ax,ax2)

    Input Arguments

    collapse all

    Axes object, specified as an Axes, PolarAxes, or GeographicAxes object.

    Name-Value Arguments

    collapse all

    Specify optional pairs of arguments as Name1=Value1,...,NameN=ValueN, where Name is the argument name and Value is the corresponding value. Name-value arguments must appear after other arguments, but the order of the pairs does not matter.

    Example: pos = tightPosition(ax1,IncludeLabels=true) returns the position of the rectangle that surrounds the title, subtitle, tick labels, and axis labels of ax1.

    Determines whether to include the title, subtitle, tick labels, and axis label in the size of the rectangle, specified as a numeric or logical 1 (true) or 0 (false). If any of the labels are close to the edge of the figure, the position rectangle might fall outside the bounds of the figure.

    Units for the rectangle coordinates, specified as one of these values.

    UnitsDescription
    "normalized" (default)Normalized with respect to the container, which is typically the figure or a panel. The lower left corner of the container maps to (0,0) and the upper right corner maps to (1,1).
    "inches"Inches.
    "centimeters"Centimeters.
    "characters"

    Based on the default system font character size.

    • Character width = width of letter x.

    • Character height = distance between the baselines of two lines of text.

    "points"Typography points. One point equals 1/72 inch.
    "pixels"

    Pixels.

    On Windows® and Macintosh systems, the size of a pixel is 1/96th of an inch. This size is independent of your system resolution.

    On Linux® systems, the size of a pixel is determined by your system resolution.

    Specifying the Units name-value argument overrides the default behavior of returning the rectangle in the units specified by the axes object.

    Output Arguments

    collapse all

    Position vector, returned as a four-element vector of the form [left bottom width height].

    This vector specifies the position and size of the circumscribing rectangle in the units specified by the Units property of the axes object.

    • The left value is the distance between the left edge of the parent container and the left edge of the rectangle. The parent container is typically a figure, panel, or tab.

    • The bottom value is the distance between the bottom edge of the parent container and the bottom edge of the rectangle.

    • The width and height values define the width and height of the rectangle.

    By default, the units are normalized values between 0 and 1, but this can be overridden by using the Units name-value argument.

    Version History

    Introduced in R2022b

    expand all