axes
Create Cartesian axes
Description
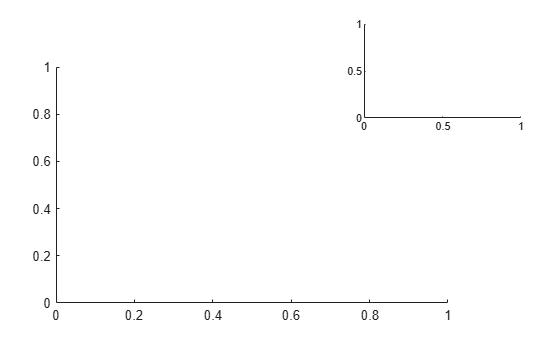
axes creates the default Cartesian axes
in the current figure and makes it the current axes. Typically, you
do not need to create axes before plotting since graphics functions
automatically create axes when plotting if they do not exist.
axes( modifies
the axes appearance or controls the way data displays using one or
more name-value pair arguments. For example, Name,Value)'FontSize',14 sets
the font size for the axes text. For a list of properties, see Axes Properties.
axes( creates
the axes in the figure, panel, or tab specified by parent,Name,Value)parent,
instead of in the current figure.
ax = axes(___)Axes object created. Use ax to
query and modify properties of the Axes object after
it is created. For a list of properties, see Axes Properties.
axes( sets the cax)CurrentAxes
property of the parent figure to be cax. If the
HandleVisibilty property of the parent figure is set to
"on", then cax also becomes the current axes. This
command also makes cax the first object listed in the
Children property of the parent object. The parent
object is typically a figure or a tiled chart layout.
Examples
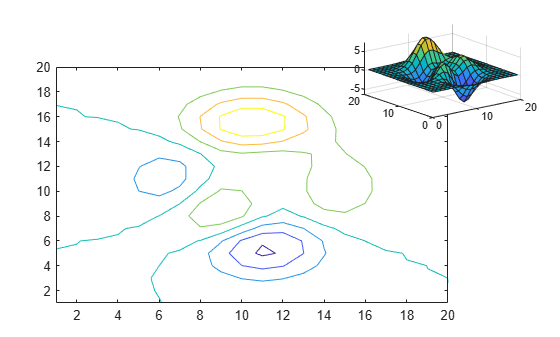
Position two Axes objects in a figure and add a plot to each one.
Specify the position of the first Axes object so that it has a lower left corner at the point (0.1 0.1) with a width and height of 0.7. Specify the position of the second Axes object so that it has a lower left corner at the point (0.65 0.65) with a width and height of 0.28. By default, the values are normalized to the figure. Return the Axes objects as ax1 and ax2.
figure
ax1 = axes('Position',[0.1 0.1 0.7 0.7]);
ax2 = axes('Position',[0.65 0.65 0.28 0.28]);
Add a plot to each Axes object. Specify the axes by passing it as the first input argument to the graphics function. Most graphics functions reset some axes properties, such as the tick values and labels. However, they do not reset the axes position.
contour(ax1,peaks(20))
surf(ax2,peaks(20))
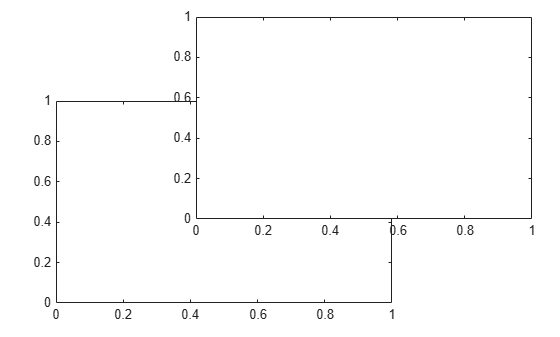
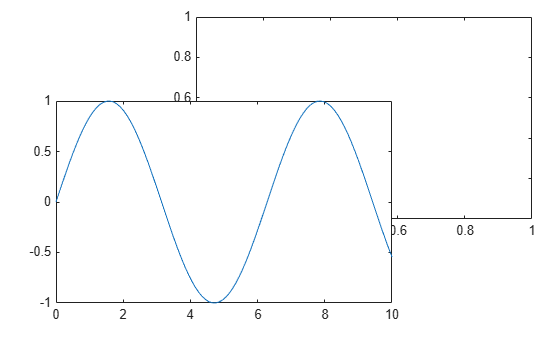
Create two overlaid Axes objects. Then, specify the current axes and add a plot.
First create two Axes objects and specify the positions. Display the box outline around each axes. Return the Axes objects as ax1 and ax2.
figure
ax1 = axes('Position',[0.1 0.1 .6 .6],'Box','on');
ax2 = axes('Position',[.35 .35 .6 .6],'Box','on');
Make ax1 the current axes. This action brings the axes to the front of the display and makes it the target for subsequent graphics functions. Add a line plot to the axes.
axes(ax1)
x = linspace(0,10);
y = sin(x);
plot(x,y)
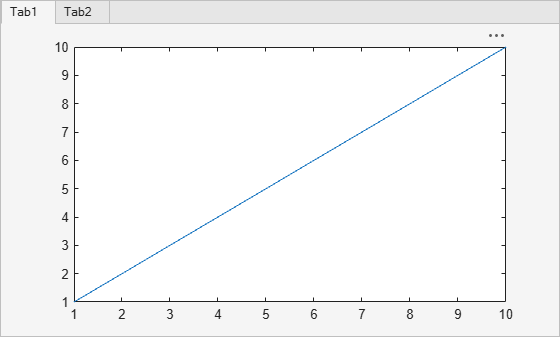
Create a figure with two tabs. Add axes to each tab by specifying the parent container for each one. Plot a line in the first tab and a surface in the second tab.
figure
tab1 = uitab('Title','Tab1');
ax1 = axes(tab1);
plot(ax1,1:10)

tab2 = uitab('Title','Tab2');
ax2 = axes(tab2);
surf(ax2,peaks)
Input Arguments
Name-Value Arguments
Example: axes('Position',[.3 .3 .5 .5]) sets
the position.
Specify optional comma-separated pairs of Name,Value arguments. Name is
the argument name and Value is the corresponding
value. Name must appear inside single quotes ('
'). You can specify several name and value pair arguments
as Name1,Value1,...,NameN,ValueN.
Some graphics functions change axes property values when plotting, such as the axis limits or tick values. Set axes properties after plotting.
Note
The properties listed here are only a subset. For a full list, see Axes Properties.
Size and location, excluding a margin for the labels, specified as a four-element vector of
the form [left bottom width height]. By default, MATLAB® measures the values in units normalized to the container. To change the units, set
the Units property.
The
leftandbottomelements define the distance from the lower left corner of the container (typically a figure, panel, or tab) to the lower left corner of the position boundary.The
widthandheightelements are the position boundary dimensions. For axes in a 3-D view, thePositionproperty is the smallest rectangle that encloses the axes.
If you want to specify the position and account for the text around the axes, then set the
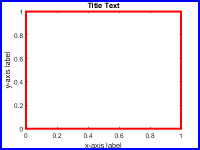
OuterPosition property instead. These figures show the areas defined by the
OuterPosition values (blue) and the Position values
(red).
| 2-D View of Axes | 3-D View of Axes |
|---|---|
|
|

For more information on the axes position, see Control Axes Layout.
Note
When querying the position of axes with constrained aspect ratios (such as square axes or those containing images) consider using the
tightPositionfunction for more accuracy. (since R2022b)Setting this property has no effect when the parent container is a
TiledChartLayout
Size and location, including the labels and a margin, specified as a four-element vector of
the form [left bottom width height]. By default, MATLAB measures the values in units normalized to the container. To change the units, set
the Units property. The default value of [0 0 1 1]
includes the whole interior of the container.
The
leftandbottomelements define the distance from the lower left corner of the container (typically a figure, panel, or tab) to the lower left corner of the outer position boundary.The
widthandheightelements are the outer position boundary dimensions.
These figures show the areas defined by the OuterPosition values (blue)
and the Position values (red).
| 2-D View of Axes | 3-D View of Axes |
|---|---|
|
|
For more information on the axes position, see Control Axes Layout.
Note
Setting this property has no effect when the parent container is a
TiledChartLayout object.
More About
Version History
Introduced before R2006a