SignalStatisticsConfiguration
R2026bDescription
Use the SignalStatisticsConfiguration object to measure signal
statistics such as maximum, minimum, peak-to-peak value, mean, variance, standard deviation,
median, RMS, and mean square.
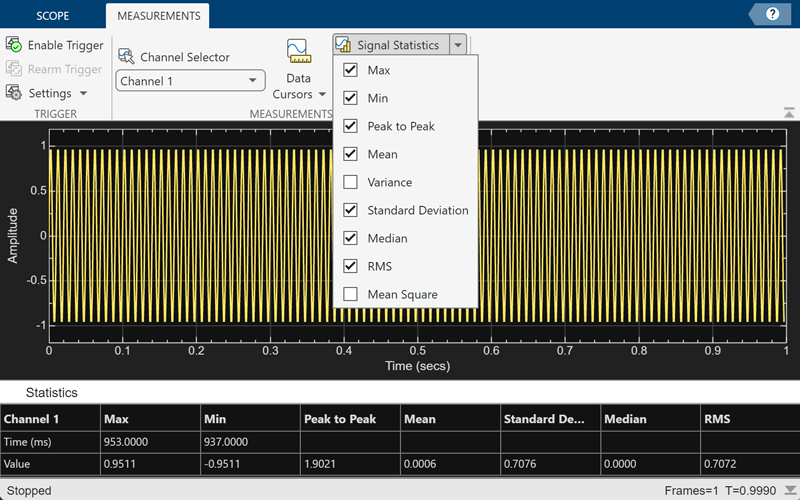
You can enable the scope to compute and display signal statistics from the toolstrip or from the command line. To enable from the scope interface, click the Measurements tab, and then click Signal Statistics. A statistics panel appears at the bottom of the scope window. To enable specific statistics, click the Signal Statistics drop-down list and select a statistic from the options. The Statistics panel shows those statistics.
Time Scope
Creation
Description
signalStats = SignalStatisticsConfiguration() creates a signal
statistics configuration object signalStats.
Properties
All properties are tunable.
Compute and display the maximum value, specified as true or
false. The scope computes and displays the maximum value of the
portion of the input signal that is currently on display in the scope.
Scope Window Use
On the Measurements tab, select Signal Statistics and then click Signal Statistics to select Max.
Data Types: logical
Compute and display the minimum value, specified as true or
false. The scope computes and displays the minimum value of the
portion of the input signal that is currently on display in the scope.
Scope Window Use
On the Measurements tab, select Signal Statistics and then click Signal Statistics to select Min.
Data Types: logical
Compute and display the peak-to-peak values, specified as true or
false. The scope computes and displays the peak-to-peak values from
the portion of the input signal that is currently on display in the scope.
Scope Window Use
On the Measurements tab, select Signal Statistics and then click Signal Statistics to select Peak to Peak.
Data Types: logical
Compute and display the mean value, specified as true or
false. The scope computes and displays the mean value of the
portion of the input signal that is currently on display in the scope.
Scope Window Use
On the Measurements tab, select Signal Statistics and then click Signal Statistics to select Mean.
Data Types: logical
Compute and display the variance, specified as true or
false. The scope computes and displays the variance of the portion
of the input signal that is currently on display in the scope.
Scope Window Use
On the Measurements tab, select Signal Statistics and then click Signal Statistics to select Variance.
Data Types: logical
Compute and display the standard deviation, specified as true or
false. The scope computes and displays the standard deviation of
the portion of the input signal that is currently on display in the scope.
Scope Window Use
On the Measurements tab, select Signal Statistics and then click Signal Statistics to select Standard Deviation.
Data Types: logical
Compute and display the median, specified as true or
false. The scope computes and displays the median of the portion of
the input signal that is currently on display in the scope.
Scope Window Use
On the Measurements tab, select Signal Statistics and then click Signal Statistics to select Median.
Data Types: logical
Compute and display the RMS, specified as true or
false. The scope computes and displays the RMS of the portion of
the input signal that is currently on display in the scope.
Scope Window Use
On the Measurements tab, select Signal Statistics and then click Signal Statistics to select RMS.
Data Types: logical
Compute and display the mean square, specified as true or
false. The scope computes and displays the mean square of the
portion of the input signal that is currently on display in the scope.
Scope Window Use
On the Measurements tab, select Signal Statistics and then click Signal Statistics to select Mean Square.
Data Types: logical
Enable signal statistics measurements, specified as true or
false. Set this property to true to enable
signal statistics measurements.
Scope Window Use
On the Measurements tab, select Signal
Statistics( ).
).
Data Types: logical
Examples
Create a sine wave and view it in the Time Scope. Enable the scope programmatically to compute the signal statistics.
The timescope object requires one of these products:
DSP System Toolbox™
Navigation Toolbox™
Sensor Fusion and Tracking Toolbox™
The timescope object supports these signal statistics:
Maximum
Minimum
Mean
Median
RMS
Peak to peak
Variance
Standard deviation
Mean square
Initialization
Create the input sine wave using the sin function. Create a timescope MATLAB® object to display the signal. Set the TimeSpan property to 1 second.
f = 100;
fs = 1000;
swv = sin(2.*pi.*f.*(0:1/fs:1-1/fs)).';
scope = timescope(SampleRate=fs,...
    TimeSpanSource="property",...
    TimeSpan=1);
Signal Statistics
Enable the scope to show signal statistics programmatically by setting the SignalStatistics > Enabled property to true.
scope.SignalStatistics.Enabled = true;
By default, the scope enables the following measurements.
scope.SignalStatistics
ans =
  SignalStatisticsConfiguration with properties:

                  ShowMax: 1
                  ShowMin: 1
           ShowPeakToPeak: 1
                 ShowMean: 1
             ShowVariance: 0
    ShowStandardDeviation: 1
               ShowMedian: 1
                  ShowRMS: 1
           ShowMeanSquare: 0
                  Enabled: 1
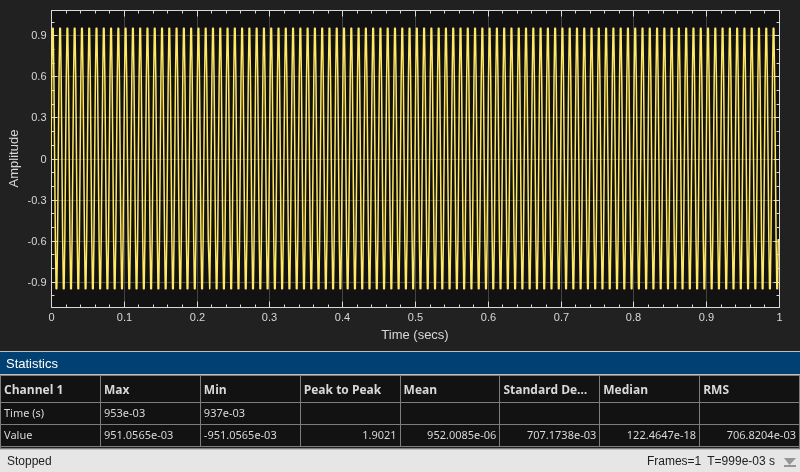
Display the sine wave in the scope. A Statistics pane appears at the bottom of the scope window displaying the statistics for the portion of the signal that you can see in the scope.
If you use the zoom options on the scope, the statistics automatically adjust to the time range in the display.
scope(swv);
release(scope);