Log Training Data to Disk
This example shows how to log custom data to disk when training agents using the Reinforcement Learning Toolbox™ train function.
Data Logging Overview
The general steps for data logging are:
Create a data logger object using the
rlDataLoggerfunction.Configure the data logger object with callback functions to specify the data to log at different stages of the training process.
Specify the logger object as a name-value input argument in the
trainfunction.
Fix Random Number Stream for Reproducibility
The example code might involve computation of random numbers at several stages. Fixing the random number stream at the beginning of some sections in the example code preserves the random number sequence in the section every time you run it, which increases the likelihood of reproducing the results. For more information, see Results Reproducibility.
Fix the random number stream with seed 0 and random number algorithm Mersenne twister. For more information on controlling the seed used for random number generation, see rng.
previousRngState = rng(0,"twister");The output previousRngState is a structure that contains information about the previous state of the stream. You will restore the state at the end of the example.
Create Data Logger
Create a file data logger object using the rlDataLogger function.
fileLogger = rlDataLogger()
fileLogger =
  FileLogger with properties:

           LoggingOptions: [1×1 rl.logging.option.MATFileLoggingOptions]
       EpisodeFinishedFcn: []
     AgentStepFinishedFcn: []
    AgentLearnFinishedFcn: []
Optionally specify the data logging directory and a naming rule for the files to be saved.
% Specify a logging directory. You must have write
% access for this directory.
logDir = fullfile(pwd,"myDataLog");
fileLogger.LoggingOptions.LoggingDirectory = logDir;

% Specify a naming rule for files. The naming rule episode<id>
% saves files as episode001.mat, episode002.mat and so on.
fileLogger.LoggingOptions.FileNameRule = "episode<id>";
Configure Data Logging
Training data of interest is generated at different stages of the training loop; for example, experience data is available after the completion of an episode. You can configure the logger object with callback functions to log data at these stages. The functions must return either a structure containing the data to log, or an empty array if no data needs to be logged at that stage.
The callback functions are:
EpisodeFinishedFcn- Callback function to log data such as experiences, logged Simulink® signals, or initial observations. The training loop executes this function after the completion of a training episode. The following is an example of the function.
function dataToLog = episodeLogFcn(data)
% episodeLogFcn logs data after every episode.
%
% data is a structure that contains the following fields:
%
% EpisodeCount: The current episode number.
% Environment: Environment object.
% Agent: Agent object.
% Experience: A structure containing the experiences
%             from the current episode.
% EpisodeInfo: A structure containing the fields
%              CumulativeReward, StepsTaken, and
%              InitialObservation.
% SimulationInfo: Contains simulation information for the
%                 current episode.
%                 For MATLAB environments this is a structure
%                 with the field "SimulationError".
%                 For Simulink environments this is a
%                 Simulink.SimulationOutput object.
%
% dataToLog is a structure containing the data to be logged
% to disk.

% Write your code to log data to disk. For example,
% dataToLog.Experience = data.Experience;

end
AgentStepFinishedFcn- Callback function to log data such as the state of exploration. The training loop executes this function after the completion of an agent step within an episode. The following is an example of the function.
function dataToLog = agentStepLogFcn(data)
% agentStepLogFcn logs data after every agent step.
%
% data is a structure that contains the following fields:
%
% EpisodeCount:   The current episode number.
% AgentStepCount: The cumulative number of steps taken by
%                 the agent.
% SimulationTime: The current simulation time in the
%                 environment.
% Agent:          Agent object.
%
% dataToLog is a structure containing the data to be logged
% to disk.

% Write your code to log data to disk. For example,
% noiseState = getState(getExplorationPolicy(data.Agent));
% dataToLog.noiseState = noiseState;

end
AgentLearnFinishedFcn- Callback function to log data such as the actor and critic training losses. The training loop executes this function after the updating the actor or critic networks. The following is an example of the function.
function dataToLog = agentLearnLogFcn(data)
% agentLearnLogFcn logs data after updating the agent's
% representations (actor or critic).
%
% data is a structure that contains the following fields:
%
% Agent           : Agent object.
% EpisodeCount    : The current episode number.
% AgentStepCount  : The cumulative number of steps taken by
%                   the agent.
%
% For agents with an actor:
% ActorLoss              : Training loss of the actor.
% ActorGradientStepCount : Cumulative number of actor
%                          gradient computation steps.
%
% For agents with a critic:
% CriticLoss   : Training loss of the critic.
% CriticGradientStepCount : Cumulative number of critic
%                gradient computation steps.
% TDTarget     : Future value of rewards as computed by
%                the target critic network.
% TDError      : Error between the critic and target
%                critic estimates of the reward.
%
% For PPO/TRPO agents:
% Advantage    : Advantage values.
%
% For PPO agents:
% AdvantageLoss: Advantage loss value.
% EntropyLoss  : Entropy loss value.
% PolicyRatio  : Ratio between current and old policies.
%
% For model-based agents:
% EnvModelTrainingInfo: A structure containing the fields:
%                       a. TransitionFcnLoss
%                       b. RewardFcnLoss
%                       c. IsDoneFcnLoss.
%
% For off-policy agents with replay memory:
% SampleIndex  : Indices of experiences sampled from the
%                replay memory for training.
%
% dataToLog is a structure containing the data to be logged
% to disk.

% Write your code to log data to disk. For example,
% dataToLog.ActorLoss = data.ActorLoss;

end
For this example, you will log the actor and critic training losses and visualize the loss data in the Reinforcement Learning Data Viewer window.
Specify the
logTrainingLossfunction for theAgentLearnFinishedFcncallback. The function is provided at the end of this example.
fileLogger.AgentLearnFinishedFcn = @logTrainingLoss;
For logging data with several agent algorithms, see Logging Functions.
Run Training
Create a predefined CartPole-continuous environment and a deep deterministic policy gradient (DDPG) agent for training.
% Set the random seed to facilitate reproducibility
rng(0,"twister");

% Create a CartPole-continuous environment
env = rlPredefinedEnv("CartPole-Continuous");

% Create a DDPG agent
obsInfo = getObservationInfo(env);
actInfo = getActionInfo(env);
agent = rlDDPGAgent(obsInfo,actInfo);
agent.AgentOptions.NoiseOptions.StandardDeviationDecayRate = 0.001;
Specify training options to train the agent for 100 episodes and visualize the training in the Reinforcement Learning Training Monitor (set the Plots option).
Note that you can still use the SaveAgentCriteria, SaveAgentValue and SaveAgentDirectory options of the rlTrainingOptions object to save the agent during training. Such options do not affect (and are not affected by) any usage of FileLogger or MonitorLogger objects.
trainOpts = rlTrainingOptions( ...
    MaxEpisodes=100, ...
    Plots="training-progress");
Train the agent using the train function. Specify the file logger object in the Logger name-value option.
results = train(agent, env, trainOpts, Logger=fileLogger);
The logged data is saved within the directory specified by logDir.
Visualize Logged Data
You can visualize data logged to disk using the interactive Reinforcement Learning Data Viewer graphical user interface. To open the visualization, click View Logged Data in the Reinforcement Learning Training Monitor window.

To create plots in the Reinforcement Learning Data Viewer, select a data from the Data panel and a choice of plot from the toolstrip. The following image shows a plot of the ActorLoss data generated using the Trend plot type. The plot shows logged data points and a moving average line.
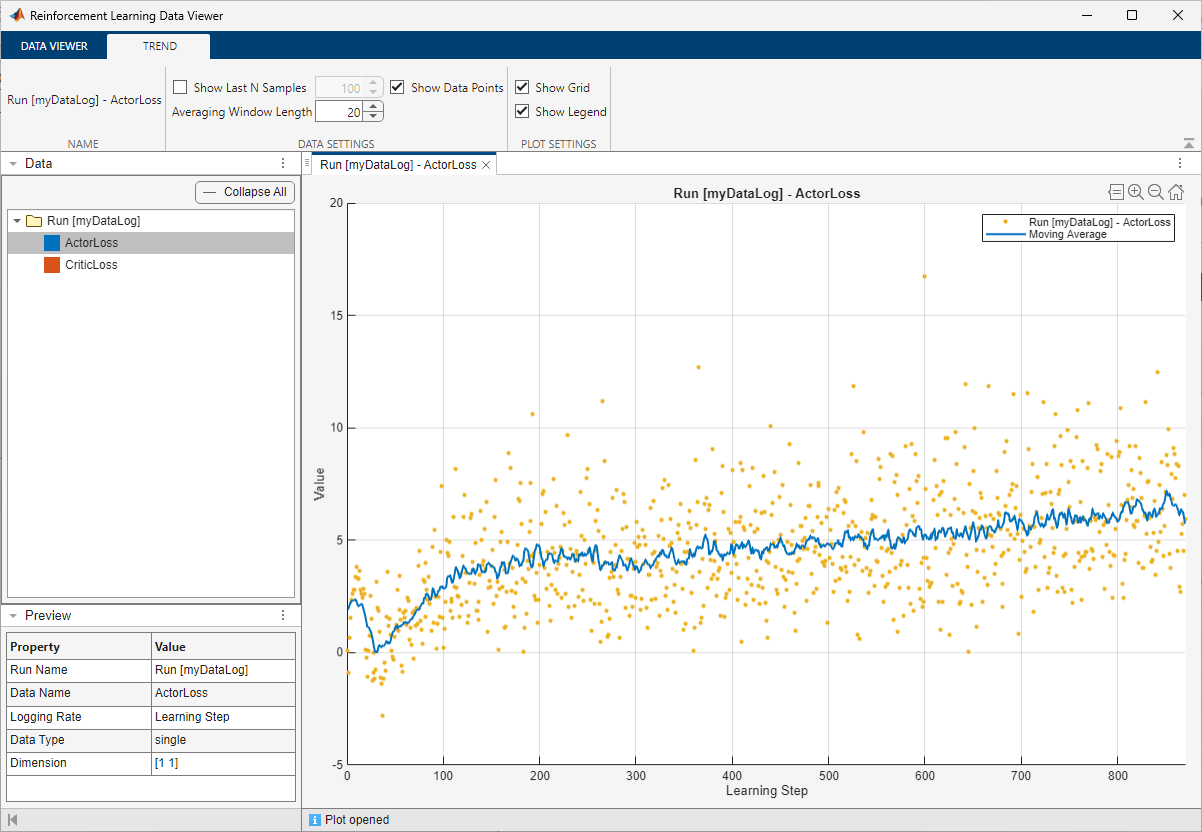
On the toolstrip, navigate to the Trend tab to configure plot options. Set the window length for averaging data to 50. The plot updates with the new configuration.

Restore the random number stream using the information stored in previousRngState.
rng(previousRngState);
Logging Functions
Use the code below to create and configure a data logger object for several built-in agent algorithms.
Q, SARSA, DQN
% Create and configure a data logger
logger = rlDataLogger();
logger.AgentLearnFinishedFcn = @agentLearnFinishedFcn;
logger.AgentStepFinishedFcn  = @agentStepFinishedFcn;
logger.EpisodeFinishedFcn    = @episodeFinishedFcn;

function dataToLog = agentLearnFinishedFcn(data)
% AgentLearnFinished callback function for Q, SARSA, DQN agents
dataToLog.CriticLoss = data.CriticLoss;
end

function dataToLog = agentStepFinishedFcn(data)
% AgentStepFinished callback function for Q, SARSA, DQN
policy = getExplorationPolicy(data.Agent);
state = getState(policy);
dataToLog.Epsilon = state.Epsilon;
end

function dataToLog = episodeFinishedFcn(data)
% EpisodeFinished callback function for Q, SARSA, DQN
dataToLog.Experience = data.Experience;
dataToLog.EpisodeReward = data.EpisodeInfo.CumulativeReward;
if data.EpisodeInfo.StepsTaken > 0
    dataToLog.EpisodeQ0 = evaluateQ0(data.Agent, ...
        data.EpisodeInfo.InitialObservation);
else
    dataToLog.EpisodeQ0 = 0;
end
DDPG, TD3
% Create and configure a data logger
logger = rlDataLogger();
logger.AgentLearnFinishedFcn = @agentLearnFinishedFcn;
logger.AgentStepFinishedFcn  = @agentStepFinishedFcn;
logger.EpisodeFinishedFcn    = @episodeFinishedFcn;

function dataToLog = agentLearnFinishedFcn(data)
% AgentLearnFinished callback function for DDPG, TD3 agents
dataToLog.ActorLoss = data.ActorLoss;
dataToLog.CriticLoss = data.CriticLoss;
dataToLog.TDError = data.TDError;
end

function dataToLog = agentStepFinishedFcn(data)
% AgentStepFinished callback function for DDPG, TD3 agents
policy = getExplorationPolicy(data.Agent);
switch policy.NoiseType
    case "ou"
        dataToLog.OUNoise = state.Noise{1};
        dataToLog.StandardDeviation = state.StandardDeviation{1};
    case "gaussian"
        dataToLog.StandardDeviation = state.StandardDeviation{1};
end
end

function dataToLog = episodeFinishedFcn(data)
% EpisodeFinished callback function for DDPG, TD3 agents
dataToLog.Experience = data.Experience;
dataToLog.EpisodeReward = data.EpisodeInfo.CumulativeReward;
if data.EpisodeInfo.StepsTaken > 0
    dataToLog.EpisodeQ0 = evaluateQ0(data.Agent, ...
        data.EpisodeInfo.InitialObservation);
else
    dataToLog.EpisodeQ0 = 0;
end
AC, PG, SAC, TRPO
% Create and configure a data logger
logger = rlDataLogger();
logger.AgentLearnFinishedFcn = @agentLearnFinishedFcn;
logger.EpisodeFinishedFcn    = @episodeFinishedFcn;

function dataToLog = agentLearnFinishedFcn(data)
% AgentLearnFinished callback function for AC, PG, SAC, TRPO agents
dataToLog.ActorLoss = data.ActorLoss;
dataToLog.CriticLoss = data.CriticLoss;
end

function dataToLog = episodeFinishedFcn(data)
% EpisodeFinished callback function for AC, PG, SAC, TRPO agents
dataToLog.Experience = data.Experience;
dataToLog.EpisodeReward = data.EpisodeInfo.CumulativeReward;
if data.EpisodeInfo.StepsTaken > 0
    dataToLog.EpisodeQ0 = evaluateQ0(data.Agent, ...
        data.EpisodeInfo.InitialObservation);
else
    dataToLog.EpisodeQ0 = 0;
end
PPO
% Create and configure a data logger
logger = rlDataLogger();
logger.AgentLearnFinishedFcn = @agentLearnFinishedFcn;
logger.EpisodeFinishedFcn    = @episodeFinishedFcn;

function dataToLog = agentLearnFinishedFcn(data)
% AgentLearnFinished callback function for PPO agents
dataToLog.ActorLoss = data.ActorLoss;
dataToLog.CriticLoss = data.CriticLoss;
dataToLog.AdvantageLoss = data.AdvantageLoss;
dataToLog.EntrpoyLoss = data.EntropyLoss;
dataToLog.PolicyRation = data.PolicyRatio;
end

function dataToLog = episodeFinishedFcn(data)
% EpisodeFinished callback function for PPO agents
dataToLog.Experience = data.Experience;
dataToLog.EpisodeReward = data.EpisodeInfo.CumulativeReward;
if data.EpisodeInfo.StepsTaken > 0
    dataToLog.EpisodeQ0 = evaluateQ0(data.Agent, ...
        data.EpisodeInfo.InitialObservation);
else
    dataToLog.EpisodeQ0 = 0;
end
MBPO
% Create and configure a data logger
logger = rlDataLogger();
logger.AgentLearnFinishedFcn = @agentLearnFinishedFcn;
logger.EpisodeFinishedFcn    = @episodeFinishedFcn;

function dataToLog = agentLearnFinishedFcn(data)
% AgentLearnFinished callback function for MBPO agents
dataToLog.ActorLoss = data.ActorLoss;
dataToLog.CriticLoss = data.CriticLoss;
mdlInfo = data.EnvModelTrainingInfo;
dataToLog.TransitionFcnLoss = mdlInfo.TransitionFcnLoss;
dataToLog.RewardFcnLoss = mdlInfo.RewardFcnLoss;
dataToLog.IsDoneFcnLoss = mdlInfo.IsDoneFcnLoss;
end

function dataToLog = episodeFinishedFcn(data)
% EpisodeFinished callback function for MBPO agents
dataToLog.Experience = data.Experience;
dataToLog.EpisodeReward = data.EpisodeInfo.CumulativeReward;
if data.EpisodeInfo.StepsTaken > 0
    dataToLog.EpisodeQ0 = evaluateQ0(data.Agent, ...
        data.EpisodeInfo.InitialObservation);
else
    dataToLog.EpisodeQ0 = 0;
end
Local Functions
function dataToLog = logTrainingLoss(data)
% Function to log the actor and critic training losses
dataToLog.ActorLoss = data.ActorLoss;
dataToLog.CriticLoss = data.CriticLoss;
end
See Also
Functions
rlDataLogger|train|sim