SkyPlotChart Properties
R2026bSky plot chart appearance and behavior
The SkyPlotChart properties control the appearance of a sky plot
chart generated using the skyplot function. To modify
the chart appearance, use dot notation on the SkyPlotChart
object:
h = skyplot([45 120 295],[10 45 60]);
h.LabelData = ["G1" "G4" "G11"];
Sky Plot Properties
Azimuth angles for visible satellite positions, specified as an n-element vector of angles or t-by-n matrix of angles. n is the number of visible satellite positions in the plot, and t is the number of time steps of the satellites. Azimuth angles are measured in degrees, clockwise-positive from the north direction, and must be in the range [0, 360].
If you specify AzimuthData as a matrix, the last row indicates
the current azimuth angles of the satellites.
Example: [25 45 182 356] specifies azimuth angles for four
satellites at one time step
Data Types: double
Elevation angles for visible satellite positions, specified as an
n-element vector of angles or
t-by-n matrix of angles. n is
the number of visible satellite positions in the plot, and t is the
number of time steps of the satellites. Elevation angles are measured from the horizon
line with 90 degrees being directly up and must be in the range
[MinElevation, 90].
If you specify ElevationData as a matrix, the last row
indicates the current elevation angles of the satellites.
Example: [45 90 27 74] specifies elevation angles for four
satellites at one time step
Data Types: double
Labels for visible satellite positions, specified as an n-element string array. n is the number of visible satellite positions in the plot.
Example: ["G1" "G11" "G7" "G3"]
Data Types: string
Group for each satellite position, specified as a categorical array. Each group has a different color label defined by the
ColorOrder
property.
Example: [GPS GPS Galileo Galileo]
Data Types: categorical
Color order, specified as a three-column matrix of RGB triplets. This property
defines the palette of colors MATLAB® uses to create plot objects such as Line,
Scatter, and Bar objects. Each row of the array
is an RGB triplet. An RGB triplet is a three-element vector whose elements specify the
intensities of the red, green, and blue components of a color. The intensities must be
in the range [0, 1]. This table lists the default colors.
| Colors | ColorOrder Matrix |
|---|---|
|
   [0.0660    0.4430    0.7450;
    0.8660    0.3290    0.0000;
    0.9290    0.6940    0.1250;
    0.5210    0.0860    0.8190;
    0.2310    0.6660    0.1960;
    0.1840    0.7450    0.9370;
    0.8190    0.0150    0.5450]
|

MATLAB assigns colors to objects according to their order of creation. For example, when plotting lines, the first line uses the first color, the second line uses the second color, and so on. If there are more lines than colors, then the cycle repeats.
You can also set the color order using the colororder
function.
Since R2026b
Minimum elevation angle for visible satellite positions, specified as a numeric
scalar in the range [-90,90). This property sets the lower boundary of the radial axis,
which represents the elevation axis in a sky plot. The radial axis limits are set to
[MinElevation 90]
The default minimum elevation angle of 0 represents the horizon. You can set the minimum elevation angle to a value less than 0 for high altitude observers that can see satellites below the horizon.
The value of MinElevation affects these other properties:
The elevation angles in
ElevationDatamust be greater than or equal toMinElevation.The mask elevation angles in
MaskElevationmust be greater than or equal toMinElevation.
Example: h = skyplot(__,MinElevation=-5)
Example: h.MinElevation = -10
Data Types: single | double | int8 | int16 | int32 | int64 | uint8 | uint16 | uint32 | uint64
Label Properties
Mask Properties
Elevation angle of mask, specified as a nonnegative scalar or
N-element vector of nonnegative values, in degrees.
N is m - 1, where m is the
number of elements in MaskAzimuthEdges.
If MaskElevation is an n-element vector,
each specified elevation mask angle in MaskElevation applies to a
corresponding azimuth interval defined by MaskAzimuthEdges. When
the MaskAzimuthEdges is its default value, the 360 degree azimuth
plane is divided into n equal angle intervals.
Example: h = skyplot(__,MaskElevation=25) applies a mask elevation
angle of 25 degrees for the entire azimuth plane.
Example: h = skyplot(__,MaskElevation=[15 30 15 10]) applies mask
elevation angles of 15, 30, 15, and 10 degrees for the azimuth angle intervals [0, 90),
[90, 180), [180, 270), and [270, 360), respectively.
Example: h = skyplot(__,MaskElevation=[15 30 15 10],MaskAzimuthEdges=[0 180
210 280 360]) applies mask elevation angles of 15, 30, 15, and 10 degrees
for the azimuth angle intervals [0, 180), [180, 210), [210, 280), and [280, 360),
respectively.
Data Types: double
Mask transparency, specified as a scalar in the range [0, 1]. A transparency value
of 1 is opaque, 0 is completely transparent, and
values between 0 and 1 are semitransparent.
Example: h = skyplot(__,MaskAlpha=0.1)
Data Types: double
Mask color, specified as an RGB triplet, a hexadecimal color code, a color name, or a short color name.
For a custom color, specify an RGB triplet or a hexadecimal color code.
An RGB triplet is a three-element row vector whose elements specify the intensities of the red, green, and blue components of the color. The intensities must be in the range
[0,1]. For example,[0.4 0.6 0.7].A hexadecimal color code is a character vector or a string scalar that starts with a hash symbol (
#) followed by three or six hexadecimal digits, which can range from0toF. The values are not case sensitive. Thus, the color codes'#FF8800','#ff8800','#F80', and'#f80'are equivalent.
Alternatively, you can specify some common colors by name. This table lists the named color options, the equivalent RGB triplets, and the hexadecimal color codes.
| Color Name | Short Name | RGB Triplet | Hexadecimal Color Code | Appearance | |
|---|---|---|---|---|---|
'red' | 'r' | [1 0 0] | '#FF0000' |
| |
'green' | 'g' | [0 1 0] | '#00FF00' |
| |
'blue' | 'b' | [0 0 1] | '#0000FF' |
| |
'cyan'
| 'c' | [0 1 1] | '#00FFFF' |
| |
'magenta' | 'm' | [1 0 1] | '#FF00FF' |
| |
'yellow' | 'y' | [1 1 0] | '#FFFF00' |
| |
'black' | 'k' | [0 0 0] | colo | '#000000' |
|
'white' | 'w' | [1 1 1] | '#FFFFFF' |
| |
'none' | Not applicable | Not applicable | Not applicable | No color |


Example: h = skyplot(__,MaskColor="r")
Data Types: double | string | char
Azimuth edges of the elevation mask, specified as an m-element row vector, where m is the total number of azimuth edges.
By default, when MaskAzimuthEdgesMode is
"auto", skyplot uses azimuth edges that would
equally divide the azimuth plane into n equal angle intervals, where
n is the number of specified elevation mask angles.
Example: h = skyplot(__,MaskElevation=[15 30 15 10]) applies mask
elevation angles of 15, 30, 15, and 10 degrees for the azimuth angle intervals [0, 90),
[90, 180), [180, 270), and [270, 360), respectively.
Example: h = skyplot(__,MaskElevation=[15 30 15 10],MaskAzimuthEdges=[0 180
210 280 360]) applies mask elevation angles of 15, 30, 15, and 10 degrees
for the azimuth angle intervals [0, 180), [180, 210), [210, 280), and [280, 360),
respectively.
Data Types: double
Mask angle azimuth edges mode, specified as "auto" or
"manual".
"auto"— Automatically divide mask angle azimuth edges evenly between0and360degrees."manual"— Specify mask angle azimuth edges manually using theMaskAzimuthEdgesproperty.
Example: h =
skyplot(__,MaskAzimuthEdgesMode="manual")
Data Types: string | char
Chart Properties
Visibility of the SkyPlotChart object handle in
the Children property of the parent, specified as one of these
values:
'on'— Object handle is always visible.'off'— Object handle is invisible at all times. This option is useful for preventing unintended changes to the UI by another function. To temporarily hide the handle during the execution of that function, set theHandleVisibilityto'off'.'callback'— Object handle is visible from within callbacks or functions invoked by callbacks, but not from within functions invoked from the command line. This option blocks access to the object at the command line, but allows callback functions to access it.
If the object is not listed in the Children property of the
parent, then functions that obtain object handles by searching the object hierarchy or
querying handle properties cannot return it. This includes get, findobj, gca, gcf, gco, newplot, cla, clf, and close.
Hidden object handles are still valid. Set the root
ShowHiddenHandles property to 'on' to list all
object handles, regardless of their HandleVisibility property
setting.
Layout options, specified as a TiledChartLayoutOptions or
GridLayoutOptions object. This property is useful when the chart
is either in a tiled chart layout or a grid layout.
To position the chart within the grid of a tiled chart layout, set the
Tile and TileSpan properties on the
TiledChartLayoutOptions object. For example, consider a 3-by-3
tiled chart layout. The layout has a grid of tiles in the center, and four tiles along
the outer edges. In practice, the grid is invisible and the outer tiles do not take up
space until you populate them with axes or charts.
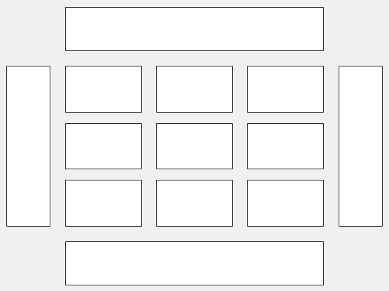
This code places the chart c in the third tile of the
grid.
c.Layout.Tile = 3;
To make the chart span multiple tiles, specify the TileSpan
property as a two-element vector. For example, this chart spans 2
rows and 3 columns of
tiles.
c.Layout.TileSpan = [2 3];
To place the chart in one of the surrounding tiles, specify the
Tile property as "north",
"south", "east", or "west".
For example, setting the value to "east" places the chart in the tile
to the right of the
grid.
c.Layout.Tile = "east";To place the chart into a layout within an app, specify this property as a
GridLayoutOptions object. For more information about working with
grid layouts in apps, see uigridlayout.
If the chart is not a child of either a tiled chart layout or a grid layout (for example, if it is a child of a figure or panel) then this property is empty and has no effect.
Parent container, specified as a Figure,
Panel, Tab,
TiledChartLayout, or GridLayout object.
Display the axes toolbar, specified as "on" or
"off", or as numeric or logical 1
(true) or 0 (false). A
value of "on" is equivalent to true, and
"off" is equivalent to false. Thus, you can
use the value of this property as a logical value. The value is stored as an on/off
logical value of type matlab.lang.OnOffSwitchState.
"on"— Display the toolbar."off"— Do not display the toolbar.
For more information about the axes toolbar, see Control Chart Interactivity.
Marker Properties
Marker edge transparency, specified as a scalar in the range
[0,1] or 'flat'. A value of 1 is opaque and 0 is
completely transparent. Values between 0 and 1 are semitransparent.
To set the edge transparency to a different value for each point in the plot, set
the AlphaData property to a vector the same size as the
XData property, and set the MarkerEdgeAlpha
property to 'flat'.
Marker outline color, specified as 'flat', an RGB triplet, a
hexadecimal color code, a color name, or a short name. The 'flat'
option uses the ColorOrder property
values.
For a custom color, specify an RGB triplet or a hexadecimal color code.
An RGB triplet is a three-element row vector whose elements specify the intensities of the red, green, and blue components of the color. The intensities must be in the range
[0,1]. For example,[0.4 0.6 0.7].A hexadecimal color code is a character vector or a string scalar that starts with a hash symbol (
#) followed by three or six hexadecimal digits, which can range from0toF. The values are not case sensitive. Thus, the color codes'#FF8800','#ff8800','#F80', and'#f80'are equivalent.
Alternatively, you can specify some common colors by name. This table lists the named color options, the equivalent RGB triplets, and the hexadecimal color codes.
| Color Name | Short Name | RGB Triplet | Hexadecimal Color Code | Appearance |
|---|---|---|---|---|
'red' | 'r' | [1 0 0] | '#FF0000' |
|
'green' | 'g' | [0 1 0] | '#00FF00' |
|
'blue' | 'b' | [0 0 1] | '#0000FF' |
|
'cyan'
| 'c' | [0 1 1] | '#00FFFF' |
|
'magenta' | 'm' | [1 0 1] | '#FF00FF' |
|
'yellow' | 'y' | [1 1 0] | '#FFFF00' |
|
'black' | 'k' | [0 0 0] | '#000000' |
|
'white' | 'w' | [1 1 1] | '#FFFFFF' |
|
'none' | Not applicable | Not applicable | Not applicable | No color |
Marker face transparency, specified as a scalar in the range
[0,1] or 'flat'. A value of 1 is opaque and 0 is
completely transparent. Values between 0 and 1 are partially transparent.
To set the marker face transparency to a different value for each point, set the
AlphaData property to a vector the same size as the
XData property, and set the MarkerFaceAlpha
property to 'flat'.
Marker fill color, specified as 'flat', an RGB triplet, a
hexadecimal color code, a color name, or a short name. The 'flat'
option uses the ColorOrder property
values.
For a custom color, specify an RGB triplet or a hexadecimal color code.
An RGB triplet is a three-element row vector whose elements specify the intensities of the red, green, and blue components of the color. The intensities must be in the range
[0,1]; for example,[0.4 0.6 0.7].A hexadecimal color code is a character vector or a string scalar that starts with a hash symbol (
#) followed by three or six hexadecimal digits, which can range from0toF. The values are not case sensitive. Thus, the color codes'#FF8800','#ff8800','#F80', and'#f80'are equivalent.
Alternatively, you can specify some common colors by name. This table lists the named color options, the equivalent RGB triplets, and hexadecimal color codes.
| Color Name | Short Name | RGB Triplet | Hexadecimal Color Code | Appearance |
|---|---|---|---|---|
'red' | 'r' | [1 0 0] | '#FF0000' |
|
'green' | 'g' | [0 1 0] | '#00FF00' |
|
'blue' | 'b' | [0 0 1] | '#0000FF' |
|
'cyan'
| 'c' | [0 1 1] | '#00FFFF' |
|
'magenta' | 'm' | [1 0 1] | '#FF00FF' |
|
'yellow' | 'y' | [1 1 0] | '#FFFF00' |
|
'black' | 'k' | [0 0 0] | '#000000' |
|
'white' | 'w' | [1 1 1] | '#FFFFFF' |
|
'none' | Not applicable | Not applicable | Not applicable | No color |
Example: [0.3 0.2 0.1]
Example: 'green'
Example: '#D2F9A7'
Marker size, specified as a positive scalar or vector of positive values in points,
where one point = 1/72 of an inch. If specified as a vector, the vector must be of the
same length as AzimuthData.
Trajectory Properties
Since R2026b
Color of satellite trajectories, specified as 'auto',
'flat', 'none', an RGB triplet, a hexadecimal
color code, a color name, or a short color name.
"auto"— The plot colors trajectories using interpolated values fromColorDatawhenColorDatais nonempty. WhenColorDatais empty,TrajectoryColoruses the"flat"option."flat"— Each trajectory color matches the fill color of the respective satellite marker, as defined by theMarkerFaceColorproperty."none"— Trajectories have no color, and are invisible.
To set a single custom color for all trajectories, specify an RGB triplet or a hexadecimal color code.
An RGB triplet is a three-element row vector whose elements specify the intensities of the red, green, and blue components of the color. The intensities must be in the range
[0,1]; for example,[0.4 0.6 0.7].A hexadecimal color code is a character vector or a string scalar that starts with a hash symbol (
#) followed by three or six hexadecimal digits, which can range from0toF. The values are not case sensitive. Thus, the color codes"#FF8800","#ff8800","#F80", and"#f80"are equivalent.
Alternatively, you can specify some common colors by name. This table lists the named color options, the equivalent RGB triplets, and hexadecimal color codes.
| Color Name | Short Name | RGB Triplet | Hexadecimal Color Code | Appearance |
|---|---|---|---|---|
'red' | 'r' | [1 0 0] | '#FF0000' |
|
'green' | 'g' | [0 1 0] | '#00FF00' |
|
'blue' | 'b' | [0 0 1] | '#0000FF' |
|
'cyan'
| 'c' | [0 1 1] | '#00FFFF' |
|
'magenta' | 'm' | [1 0 1] | '#FF00FF' |
|
'yellow' | 'y' | [1 1 0] | '#FFFF00' |
|
'black' | 'k' | [0 0 0] | '#000000' |
|
'white' | 'w' | [1 1 1] | '#FFFFFF' |
|
Example: h = skyplot(__,TrajectoryColor="r") colors all
trajectories red.
Example: h.TrajectoryColor = "flat" matches each trajectory to its
marker face color.
Example: h.TrajectoryColor = [0 0.4 0.7] applies a custom RGB
color to all trajectories.
Data to color trajectories, specified as a
t-by-n matrix of numeric values that is the same
size as AzimuthData and ElevationData.
n is the number of visible satellite positions in the plot, and
t is the number of time steps of the satellites. Each element of
the matrix represents the color data for the corresponding time step and
satellite.
You can use this property to visualize attributes of each satellite along its
trajectory. For example, if you set ColorData to signal-to-noise
ratio values, you can visualize the signal quality along the path of each
satellite.
For ColorData to control trajectory colors, the value of
TrajectoryColor must be "auto". When
TrajectoryColor is not "auto", the
ColorData property has no effect on trajectory colors.
When ColorData is nonempty and TrajectoryColor
is set to "auto":
The plot colors trajectories using interpolated values from
ColorData. The plot maps the values inColorDatato colors according to theColormap,ColorLimits, andColorScalingproperties.A color bar appears by default. You can control the color bar using the
ColorbarVisibleandColorbarLabelproperties.
When ColorData is empty, the trajectories use the colors defined
by TrajectoryColor, and the color bar is invisible.
Example: h =
skyplot(__,ColorData=carrierToNoiseRatios)
Data Types: single | double | int8 | int16 | int32 | int64 | uint8 | uint16 | uint32 | uint64
Colormap used to map ColorData values to trajectory colors,
specified as one of these values:
Predefined colormap name — Specify the colormap name, such as
parulaorsummer. For a full list of options, seecolormap.Custom colormap — Specify an m-by-3 matrix of RGB triplets where each row defines one color. An RGB triplet is a three-element row vector whose elements specify the intensities of the red, green, and blue components of the color. The intensities can be
doubleorsinglevalues in the range [0, 1], or they can beuint8values in the range [0, 255].
When the figure theme is light, the default colormap is sky. When
the figure theme is dark, the default colormap automatically switches to
abyss for better contrast.
Setting this property has an effect only when ColorData is
non-empty and TrajectoryColor is "auto". The
ColorLimits and ColorScaling properties control
how ColorData values map to the colors of the colormap.
Example: h = skyplot(__,Colormap=summer)
Example: h.Colormap = winter
Data Types: single | double | uint8
Scale for mapping color data to colormap colors, specified as one of these values:
"literal"— Linearly map values inColorDatabetweenColorLimits(1)andColorLimits(2)to theColormap."log"— Calculate the log of each value in theColorDataproperty before mapping the values to colors in theColormap. Negative values appear as missing data. However, if all the values are negative, then this option uses-log(-value). Use this option whenColorDataspans several orders of magnitude.
Setting this property has an effect only when ColorData is
non-empty and TrajectoryColor is "auto".
Example: h = skyplot(__,ColorScaling="log")
Data Types: char | string
Limits for mapping color data to the colormap, specified as a two-element vector of
the form [cmin cmax], where cmax must be greater
than cmin. These limits determine how the values in
ColorData map to the colormap specified by
Colormap:
Values that are less than or equal to
cminmap to the first color in theColormap.Values that are greater than or equal to
cmaxmap to the last color in theColormap.Values between
cminandcmaxmap to the intermediate colors inColormapeither linearly or logarithmically, depending on the value ofColorScaling.
The default value of this property depends on whether ColorData
is empty or nonempty.
ColorDatais empty — [0 1]ColorDatais nonempty —[min(ColorData,[],"all") max(ColorData,[],"all")]
Setting this property manually sets ColorLimitsMode to
"manual".
Setting this property has an effect only when ColorData is
non-empty and TrajectoryColor is "auto".
Example: h = skyplot(__,ColorLimits=[0 10])
Example: h.ColorLimits = [20 50]
Data Types: single | double | int8 | int16 | int32 | int64 | uint8 | uint16 | uint32 | uint64
Selection mode for color limits, specified as one of these values:
"auto"— IfColorDatais nonempty, the plot set the first and second elements ofColorLimitsto the minimum and maximum values ofColorData, respectively. IfColorDatais empty, thenColorLimitsis[0 1]. The limits update automatically wheneverColorDatachanges."manual"— Use the currentColorLimitsvalue. The limits do not update automatically whenColorDatachanges.
Setting the ColorLimits property automatically changes
ColorLimitsMode to "manual". To return to
automatic limit calculation, set ColorLimitsMode back to
"auto".
Example: h = skyplot(__,ColorLimitsMode="manual") keeps the
current ColorLimits fixed even if ColorData
changes.
Example: h.ColorLimitsMode = "auto" sets limits automatically
based on the ColorData range if ColorData is
nonempty. If ColorData is empty, sets ColorLimits
to [0 1].
Data Types: char | string
Color bar label, specified as a character vector or string scalar. The label appears
next to the color bar when the color bar is visible. The color bar is visible only when
ColorData is nonempty, TrajectoryColor is
"auto", and ColorbarVisible is
"on".
Example: h = skyplot(__,ColorbarLabel="C/N0")
Data Types: char | string
Color bar visibility, specified as "on" or
"off", or as numeric or logical 1 (true) or 0
(false). A value of "on" is equivalent to
true, and "off" is equivalent to
false. Thus, you can use the value of this property as a logical
value. The value is stored as an on/off logical value of type matlab.lang.OnOffSwitchState.
"on"— Display a color bar that shows howColorDatavalues map to the colors inColormap. The plot displays the color bar only whenColorDatais non-empty andTrajectoryColoris"auto"."off"— Hide the color bar.
Example: h = skyplot(__,ColorbarVisible="off")
Example: h.ColorbarVisible = "on"

