rceps
Real cepstrum and minimum-phase reconstruction
Syntax
Description
Examples
A speech recording includes an echo caused by reflection off a wall. Use the real cepstrum to filter it out.
In the recording, a person says the word MATLAB®. Load the data and the sample rate, .
load mtlb

% To hear, type soundsc(mtlb,Fs)
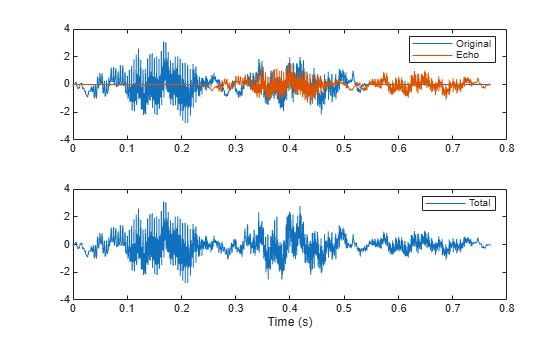
Model the echo by adding to the recording a copy of the signal delayed by samples and attenuated by a known factor : . Specify a time lag of 0.23 s and an attenuation factor of 0.5.
timelag = 0.23;
delta = round(Fs*timelag);
alpha = 0.5;

orig = [mtlb;zeros(delta,1)];
echo = [zeros(delta,1);mtlb]*alpha;

mtEcho = orig + echo;
Plot the original, the echo, and the resulting signal.
t = (0:length(mtEcho)-1)/Fs;

% To hear, type soundsc(mtEcho,Fs)

subplot(2,1,1)
plot(t,[orig echo])
legend("Original","Echo")

subplot(2,1,2)
plot(t,mtEcho)
legend("Total")
xlabel("Time (s)")
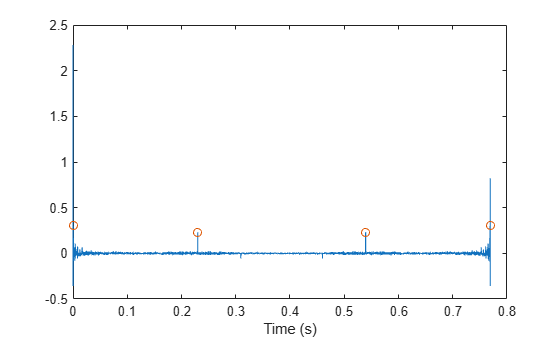
Compute the real cepstrum of the signal. Plot the cepstrum and annotate its maxima. The cepstrum has a sharp peak at the time at which the echo starts to arrive.
c = rceps(mtEcho);

[px,locs] = findpeaks(c,Threshold=0.2,MinPeakDistance=0.2);

clf
plot(t,c,t(locs),px,"o")
xlabel("Time (s)")
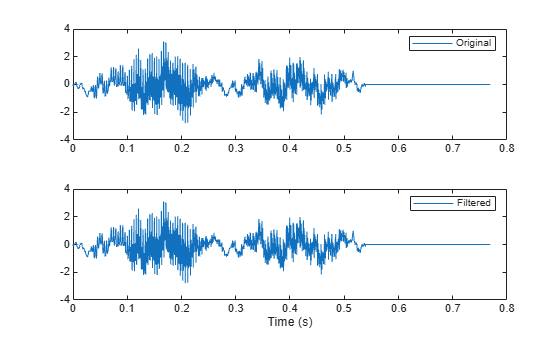
Cancel the echo by filtering the signal through an IIR system whose output obeys . Plot the filtered signal and compare it to the original.
dl = locs(2)-1;

mtNew = filter(1,[1 zeros(1,dl-1) alpha],mtEcho);

% To hear, type soundsc(mtNew,Fs)

subplot(2,1,1)
plot(t,orig)
legend("Original")

subplot(2,1,2)
plot(t,mtNew)
legend("Filtered")
xlabel("Time (s)")
Input Arguments
Output Arguments
Algorithms
The real cepstrum is the inverse Fourier transform of the real logarithm of the magnitude of the Fourier transform of a sequence.
Note
rceps only works on real data.
rceps is an implementation of algorithm 7.2 in [2], that is,
y = real(ifft(log(abs(fft(x)))));
Appropriate windowing in the cepstral domain forms the reconstructed minimum-phase signal:
w = [1;2*ones(n/2-1,1);ones(1-rem(n,2),1);zeros(n/2-1,1)];
ym = real(ifft(exp(fft(w.*y))));
References
[1] Oppenheim, Alan V., and Ronald W. Schafer. Digital Signal Processing, Englewood Cliffs, NJ, Prentice-Hall, 1975.
[2] Programs for Digital Signal Processing, IEEE Press, New York, 1979.
Extended Capabilities
Version History
Introduced before R2006a