extract
Extract time-domain, frequency-domain, or time-frequency-domain features
Since R2021b
Syntax
Description
[
also returns a structure features,infoFeatures] = extract(sFE,src)infoFeatures that maps a specific feature to
its column location in the output feature matrix features. This syntax
is valid only when you set the FeatureFormat property of the feature
extractor object to "matrix".
[
returns a matrix features,infoFeatures,frameLimits] = extract(sFE,src)frameLimits whose
ith row contains the beginning and end
limits of the ith frame. This syntax is valid
only when you set the FeatureFormat property of the feature extractor
object to "matrix".
Examples
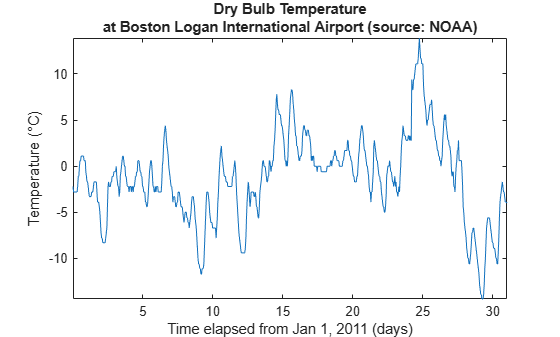
Load a set of temperature readings in degrees Celsius taken every hour at Boston Logan International Airport for 31 days. Plot the data.
load bostemp
t = (1:31*24)/24;
plot(t,tempC)
axis tight
ylabel("Temperature (\circC)")
xlabel("Time elapsed from Jan 1, 2011 (days)")
title({"Dry Bulb Temperature" ...
        "at Boston Logan International Airport (source: NOAA)"})
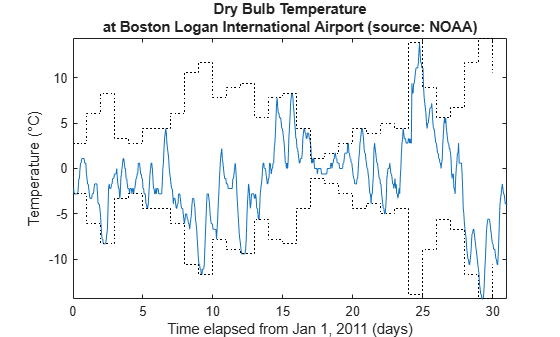
Create a signalTimeFeatureExtractor object and enable the PeakValue feature. To obtain the maximum absolute temperature reading per day, set the frame size to 24 samples and the frame overlap to 0 samples.
fl = 24;
sFE = signalTimeFeatureExtractor(FrameSize=fl, ...
    FrameOverlapLength=0,PeakValue=true);
Call the extract function on the object to extract the absolute value of the daily maximum temperatures in the data set. Plot the extracted peak values along with the hourly dry-bulb temperature readings.
peaktemps = extract(sFE,tempC);
hold on
stairs(0:numel(peaktemps)-1,peaktemps*[-1 1],":k")
hold off
Confirm the extracted peak values. Divide the signal into 24-sample segments representing temperature readings per day and compute the maximum absolute value of each segment. Compare the resulting vector to peaktemps.
y = framesig(tempC,fl);
[mx,idx] = max(abs(y));

tf = isequal(peaktemps,mx')
tf = logical
   1
Load a set of temperature readings in degrees Celsius taken every hour at Boston Logan International Airport for 31 days. Plot the data.
load bostemp
t = (1:31*24)/24;
plot(t,tempC)
axis tight
ylabel("Temperature (\circC)")
xlabel("Time elapsed from Jan 1, 2011 (days)")
title({"Dry Bulb Temperature" ...
        "at Boston Logan International Airport (source: NOAA)"})

Convert the array of temperature readings to a timetable. The first temperature reading was taken on January 1, 2011.
tt = array2timetable(tempC, ...
    TimeStep=hours(1),StartTime=datetime(2011,01,01));
Create a signalTimeFeatureExtractor object and enable the Mean feature to obtain the weekly average temperatures. Specify the sample rate and frame size (1 week = 168 hours) of the extractor. Set the output format of the extracted values to a table.
fs = 1/3600;
sFE = signalTimeFeatureExtractor(SampleRate=fs, ...
    FrameSize=168,Mean=true,FeatureFormat="table");
Call the extract function to extract the weekly average temperatures from the data set. The function does not include the readings taken in the last three days (72 hours) since they do not span a full week.
meantemps = extract(sFE,tt)
meantemps=4×3 table
    FrameStartTime    FrameEndTime     Mean
    ______________    ____________    _______

           1              168         -1.8357
         169              336         -4.3095
         337              504          1.7976
         505              672          2.0911
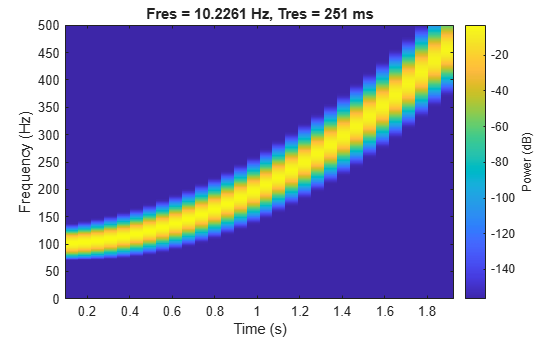
Consider a quadratic chirp sampled at 1 kHz for 2 seconds. The chirp has an initial frequency of 100 Hz that increases to 200 Hz at t = 1 second. Compute and display the spectrogram.
fs = 1e3;
t = 0:1/fs:2;
y = chirp(t,100,1,200,"quadratic");
pspectrum(y,fs,"spectrogram")
Create a signalFrequencyFeatureExtractor object to obtain the mean and median frequencies from the signal. Specify the sample rate.
sFE = signalFrequencyFeatureExtractor(SampleRate=fs, ...
    MeanFrequency=true,MedianFrequency=true);
Extract the features. info returns the column index in features of each extracted feature.
[features1,info1] = extract(sFE,y)
features1 = 1×2

  226.0160  199.7034
info1 = struct with fields:
      MeanFrequency: 1
    MedianFrequency: 2
Set the FrameSize and FrameRate properties of the feature extractor object to divide the signal into two frames. The first frame represents the chirp oscillating at the initial frequency of 100 Hz and the second frame represents the chirp oscillating at 200 Hz. Extract the mean and median frequencies for each frame and include the frame limits in the output.
sFE.FrameSize = round(length(y)/2);
sFE.FrameRate = 1000;
[features2,info2,frameLimits] = extract(sFE,y)
features2 = 2×2

  131.4921  124.9820
  331.2664  324.6992
info2 = struct with fields:
      MeanFrequency: 1
    MedianFrequency: 2
frameLimits = 2×2

           1        1001
        1001        2001
Since R2025a
Extract time-domain, frequency-domain, and time-frequency features from healthy bearing vibration signals and faulty bearing vibration signals. While a healthy bearing vibration signal does not have outstanding defects, a faulty bearing vibration signal results from wear-and-tear defects, such as spalls on the gear teeth, eccentricity or gear misalignment, and cracks at the races.
For more information on bearing signal generation and analysis, see Vibration Analysis of Rotating Machinery. To learn more about the feature extraction and model training workflow to identify faulty bearing signals in mechanical systems, see Machine Learning and Deep Learning Classification Using Signal Feature Extraction Objects.
Generate Healthy Bearing Signal
Generate a healthy bearing vibration signal as a sum of three cosine pulses with amplitudes of 0.4 V, 0.2 V, and 1 V, respectively, and frequencies of 22.5 Hz, 8.36 Hz, and 292.5 Hz, respectively, for three seconds and with a sample rate of 20 kHz. Generate Gaussian noise and add it to the signal.
rng("default")
Fs = 20e3;
t = (0:1/Fs:3-1/Fs)';

a = [0.4 0.2 1];
f = [22.5 8.36 292.5];
sClean = cos(2*pi*f.*t)*a';
sHealthy = sClean + 0.2*randn(size(t));
Generate Faulty Bearing Signal
Generate a faulty bearing vibration signal by adding a bearing impact signal to the healthy bearing signal. Model each impact as a 3 kHz sinusoid windowed by a Kaiser window. The defect causes a series of 10-millisecond impacts on the bearing.
tImpact = t(t<10e-3)';
xImpact = sin(2*pi*3000*tImpact).*kaiser(length(tImpact),40)';

xImpactBper = 0.33*pulstran(t,0:1/104.5:t(end),xImpact,Fs);
Generate a faulty bearing vibration signal using the healthy bearing signal and the bearing impact signal.
sFaulty = sHealthy + xImpactBper;
Consolidate and Visualize Signals
Bundle the healthy bearing and faulty bearing signals in a signalDatastore object in single precision.
sds = signalDatastore({sHealthy,sFaulty},OutputDataType="single");Plot the power spectrum of the healthy and faulty vibration signals. Observe the peaks that correspond to the bearing impact.
[P,F] = pspectrum([sHealthy sFaulty],Fs);
p = plot(F/1000,pow2db(P));
p(1).Marker = ".";
xlabel("Frequency (kHz)")
ylabel("Power Spectrum (dB)")
legend(["Healthy" "Faulty"])

Set Up Feature Extraction Pipeline
Create a signalTimeFeatureExtractor object for time-domain feature extraction.
timeFE = signalTimeFeatureExtractor(SampleRate=Fs,...
    RMS=true,ImpulseFactor=true,StandardDeviation=true);
Create a signalFrequencyFeatureExtractor object for frequency-domain feature extraction.
freqFE = signalFrequencyFeatureExtractor(SampleRate=Fs, ...
    MedianFrequency=true,BandPower=true,PeakAmplitude=true);
Create a signalTimeFrequencyFeatureExtractor object to extract time-frequency features from a spectrogram. Set the leakage parameter for the spectrogram to 90%.
timeFreqFE = signalTimeFrequencyFeatureExtractor(SampleRate=Fs, ...
    SpectralKurtosis=true,SpectralSkewness=true,TFRidges=true);

setExtractorParameters(timeFreqFE,"spectrogram",Leakage=0.9);
Extract Multidomain Features
Extract signal features using all three feature extractors for the signals in the signalDatastore object sds. Concatenate the multidomain features. Display the first four columns in a feature table.
featureCell = cellfun(@(a,b,c) [real(a) real(b) real(c)], ...
    extract(timeFE,sds),extract(freqFE,sds),extract(timeFreqFE,sds), ...
    UniformOutput=false);

featureMatrix = cell2mat(featureCell);
featureTable = array2table(featureMatrix);
head(featureTable(:,1:4))
    featureMatrix1    featureMatrix2    featureMatrix3    featureMatrix4
    ______________    ______________    ______________    ______________

       0.80115           0.80116            3.2635            292.39
       0.80538           0.80539            3.1501            292.41