Statistiques descriptives
Utilisez findpeaks pour trouver les maxima locaux d’un signal et trier les crêtes par hauteur, largeur ou proéminence. Déterminez le facteur de crête d’un signal avec la fonction peak2rms. Calculez des statistiques descriptives courantes comme les maxima, les minima, les écarts-types et les niveaux RMS. Recherchez les signaux d’intérêt dans des jeux de données plus grands et recalez les signaux dans le temps. Localisez les points où un signal change brusquement ou dérive au-delà d’une plage cible. Labellisez les signaux pour l’analyse ou pour des applications de Machine Learning et de Deep Learning.
Applications
| Signal Analyzer | Visualiser et comparer plusieurs signaux et spectres |
| Signal Labeler | Label signal attributes, regions, and points of interest |
| Signal Feature Extractor | Extract and analyze signal features (depuis R2025a) |
Fonctions
Rubriques
- Use Signal Feature Extractor App
Extract and rank features from signals interactively. Prepare signal datasets for classification tasks.
- RMS Value of Periodic Waveforms
Find the root mean square value of a sine wave, a square wave, and a rectangular pulse train.
- Find Peaks in Data
Locate the local maxima in a set of data and determine if those peaks occur periodically.
- Proéminence
La proéminence d’un pic est la mesure dans laquelle le pic se démarque en raison de sa hauteur intrinsèque et de son emplacement par rapport aux autres pics.
- Human Activity Recognition Simulink Model for Smartphone Deployment (Statistics and Machine Learning Toolbox)
Generate code from a classification Simulink® model prepared for deployment to a smartphone.
- Choose an App to Label Ground Truth Data
Decide which app to use to label ground truth data: Image Labeler, Video Labeler, Ground Truth Labeler, Lidar Labeler, Signal Labeler, or Medical Image Labeler.
Sélection d՚exemples

Measure Signal Similarities
Compare signals with different sample rates or frequency content, measure delays, and determine if there is a signal in a measurement.
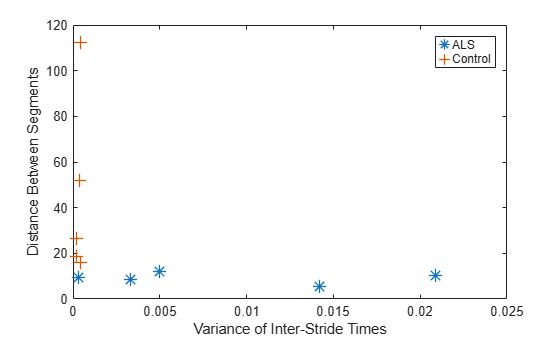
Extract Classification Features from Physiological Signals
Quantify interstride time intervals and measure walking-pattern similarity; construct a feature vector to classify signals.

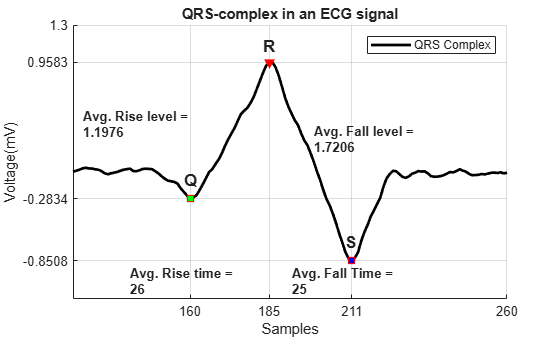
Automate Signal Labeling with Custom Functions
Use Signal Labeler to locate and label QRS complexes and R peaks of ECG signals.

Label Spoken Words in Audio Signals
Use Signal Labeler to label spoken words in an audio signal.

Label Signal Attributes, Regions of Interest, and Points
Use Signal Labeler to label attributes, regions, and points of interest in a set of whale songs.
Peak Analysis
Find peaks in a noisy signal and measure their amplitude and the distance between them.

Detect Outbreaks and Significant Changes in Signals
Determine significant changes or outbreaks in signals using cumulative sums and changepoint detection.
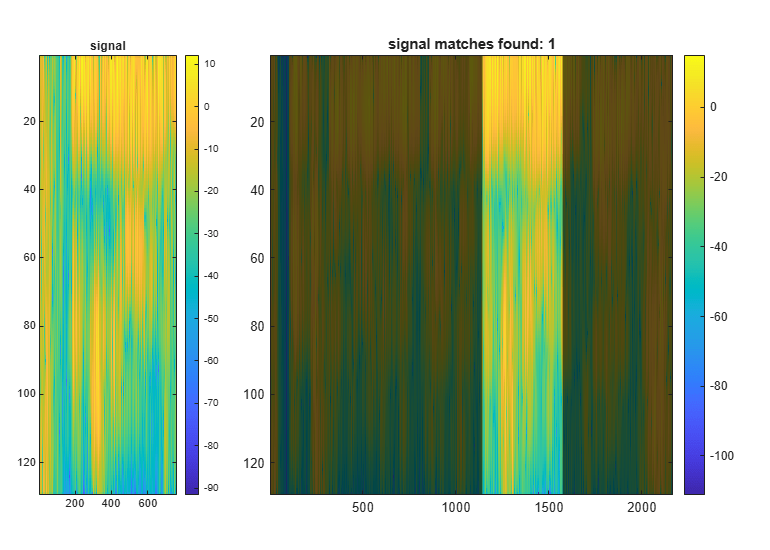
Finding a Signal in Data
Find exactly and closely matching signals and allow for variations in sampling by warping the time axis.