Apply Temperature-Dependent Cell Parameter Variations to Battery Module
This example shows how to apply temperature-dependent parameter variations to the individual cell models in a battery module generated using Simscape™ Battery™ objects and functions. Modeling temperature-dependent parameter variation is essential for achieving accurate performance predictions, optimizing efficiency, and designing and developing advanced battery systems.
This example also highlights one of the significant advantages of modeling batteries in Simscape Battery, rather than using only Simulink® blocks. When you introduce cell-to-cell variation, the conservation laws in Simscape automatically allocate current among the parallel-connected cells. Achieving automatic current allocation using only Simulink blocks is highly challenging and complex.
Create Module Block
Define the geometry of the battery cell by creating a PouchGeometry object. To create a PouchGeometry object, use the batteryPouchGeometry function and specify the cell height as the first argument, the cell length as the second argument, and the location and width of the tabs.
cellGeometry = batteryPouchGeometry(simscape.Value(0.13,"m"),...
    simscape.Value(0.36,"m"),...
    TabLocation="Opposed",...
    TabWidth=simscape.Value(0.05,"m"));
Use the PouchGeometry object to create a pouch battery cell with a mass of 0.8 kg. To create the Cell object, use the batteryCell function and specify the cell geometry as the first argument. To specify the cell mass, use the name-value argument Mass.
cell = batteryCell(cellGeometry,Mass=simscape.Value(0.8,"kg"));By default, a Cell object uses the Battery Equivalent Circuit block as Simscape cell model block.
disp(cell.CellModelOptions.CellModelBlockPath);
batt_lib/Cells/Battery Equivalent Circuit
Set these options for the battery cell:
The equivalent circuit of the cell contains one parallel RC section.
A lumped thermal mass defines the thermal model of the battery cell.
cell.CellModelOptions.BlockParameters.RCPairs = "rc1";
cell.CellModelOptions.BlockParameters.ThermalModel = "LumpedThermalMass";
Plot the battery cell using the batteryChart object.
f = figure(Color="w",Position=[0,0,1000,500]);
moduleChart = batteryChart(f,cell);
title(moduleChart,"Cell Chart");

Next use the batteryParallelAssembly function and the Cell object to create the ParallelAssembly object. Use the Cell object as the first argument and the number of parallel cells as the second argument. To specify the additional parallel assembly properties, use the name-value arguments Topology and InterCellGap.
parallelAssembly = batteryParallelAssembly(cell,2, ...
    Topology="SingleStack",...
    InterCellGap=simscape.Value(0.001,"m"));
Plot the parallel assembly using the BatteryChart object.
f = figure(Color="w",Position=[0,0,1000,500]);
moduleChart = batteryChart(f,parallelAssembly);
title(moduleChart,"Parallel Assembly Chart");

Next, use the batteryModule function and the ParallelAssembly object to create a Module object. Use the ParallelAssembly object as the first argument and the number of parallel assemblies in series as the second argument. To specify the additional module properties, use the name-value arguments InterParallelAssemblyGap, ModelResolution, and AmbientThermalPath. The model resolution defines the number of cells represented by an individual cell model. In a detailed module, an individual cell model represents each cell in the module.
module = batteryModule(parallelAssembly,3,...
    InterParallelAssemblyGap=simscape.Value(0.008,"m"),...
    ModelResolution="Detailed",...
    AmbientThermalPath="CellBasedThermalResistance");
Enable the option to model cell-to-cell parameter variation. When you set the CellParameterVariation property to "PercentDeviation", the cell parameters in the generated Module block have an associated Percent deviation parameter that specifies the percent deviation of the value of the corresponding cell parameter for each cell model in the battery. The value of the corresponding cell parameter with the deviation applied is equal to:
The number of cell models in the battery and the model resolution define the size of the Percent deviation parameter.
module.CellParameterVariation = "PercentDeviation";Plot the module using the BatteryChart object.
f = figure(Color="w",Position=[0,0,1000,500]);
moduleChart = batteryChart(f,module);
title(moduleChart,"Module Chart")

To create a library that contains the Simscape Battery model of the Module object in this example, use the buildBattery function.
if not(isfolder("+ModuleTemperatureDependentVariation\") | isfile("ModuleTemperatureDependentVariation_lib.slx"))
    buildBattery(module,LibraryName="ModuleTemperatureDependentVariation",MaskParameters="VariableNamesByType");
end
Simulate Module Without Parameter Variation
Open the DetailedModuleDischarge model. In this model, a Discharger block discharges the battery module with a constant discharging current of 54 A until the voltage of the module is less than or equal to 6 V. The Module1 block is a custom block created from the Simscape Battery Module object.
open_system("DischargeDetailedModule");
Decrease the cell-level ambient thermal resistance of the generated Module block to 0.5 K/W and run the simulation.
Module1.AmbientResistance = 0.5;
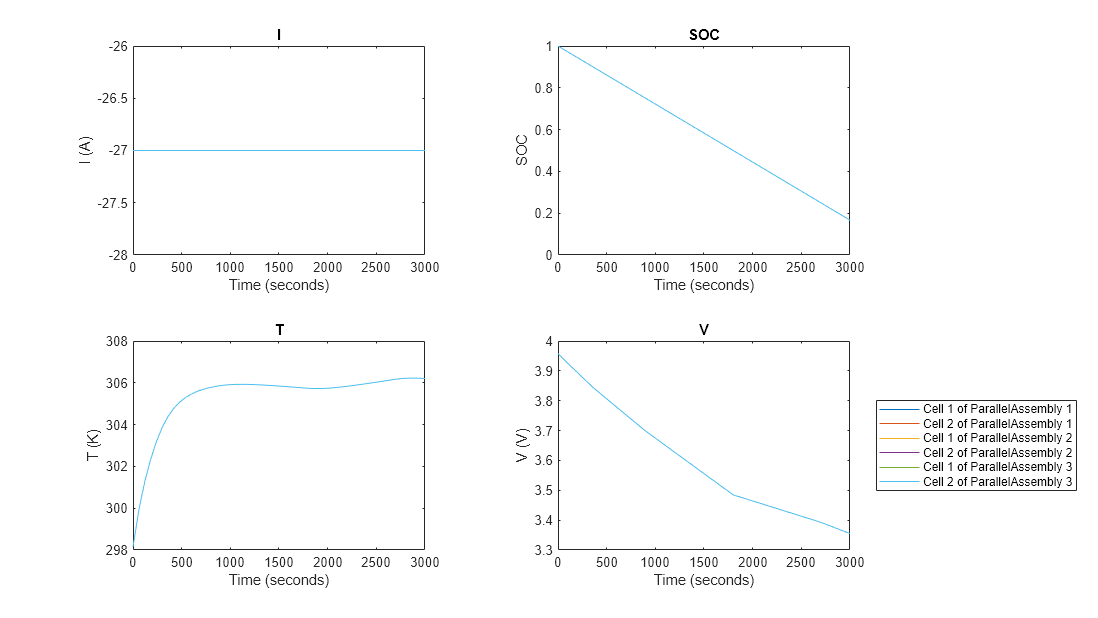
out = sim("DischargeDetailedModule");Plot and visualize the simulation results. These plots show the values of the current, state of charge (SOC), temperature, and voltage in each cell of each parallel assembly inside the module. The values for all the different cells overlap, which indicates that all cells currently perform identically.
plotSimResults(out);
Simulate Module with Capacity Variation
Double-click the Module1 block to open the Block Parameters dialog box. Because the CellParameterVariation property of the Module object is PercentDeviation, the software associates a percent deviation parameter with each corresponding parameter in the Main and Open Circuit Voltage sections. Each element of this parameter represents the deviation of the parameter for one specific cell model in the module.

The detailed module comprises three parallel assemblies with two cells each. A unique cell model represents every cell in the battery, for a total of six cell models. The values of the percent derivation parameters, such as Percent derivation for BatteryCapacityCell, are column vectors with a length of 6. You can review the design of the battery in the Description tab.

Simulate the behavior of a battery when the individual cells have a variation in the capacity. Manufacturing inaccuracies or different values of the state of health (SOH) of the batteries can cause this variation.
Module1.BatteryCapacityCellPercentDeviation = [5;-1;-3;-2;4;1];
With these variation settings, the second and third parallel assemblies have the lowest and highest capacities, respectively. Inside the first parallel assembly, the first cell has higher capacity than the second cell. These two cells are connected in parallel and have the same voltage.
Simulate the model and plot the results. These plots show the values of the current, SOC, temperature, and voltage in each cell of each parallel assembly inside the module.
out = sim('DischargeDetailedModule');
plotSimResults(out);
To see the differences between the cells, increase the zoom of the plots.
plotSimResults(out,[1000 1100]);
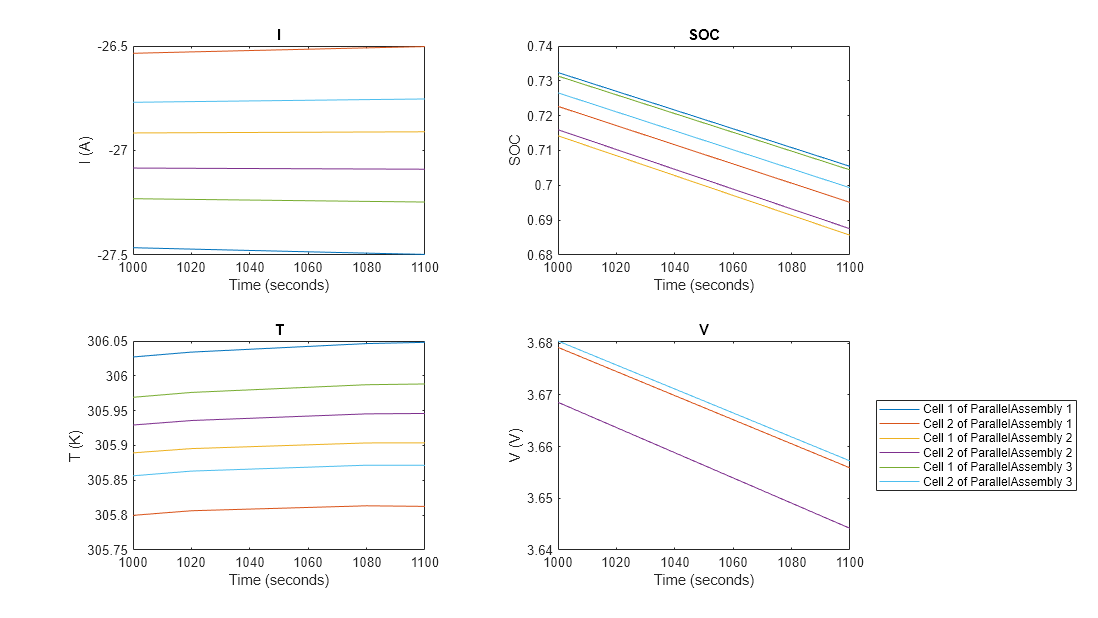
The SOC and voltage of the second parallel assembly are lower than the SOC and voltage of the other parallel assemblies, due to the second parallel assembly having lowest capacity. The SOC and voltage of the third parallel assembly are the highest among the three parallel assemblies. Within the first parallel assembly, the high capacity of the first cell provides higher current than the second cell.
Simulate Module with Resistance Variation and Temperature Dependency
Simulate the behavior of the battery module when you add a temperature-dependent variation in the instantaneous resistance, .
By default, the Instantaneous resistance, R0(SOC,T) parameter of the Battery Equivalent Circuit block is a 7-by-3 matrix, with seven SOC breakpoints and three temperature breakpoints. The battery module in this model comprises six cells. To model this configuration, set the parameter variation by using a 6-by-1 vector and specify the same percent derivation for the same cell, regardless of the temperature and SOC.
To specify an SOC-dependent and temperature-dependent variation, you must then specify a 42-by-3 matrix, by concatenating six 7-by-3 matrices along the rows, where six is the number of cells in the module. Each 7-by-3 matrix corresponds to the Instantaneous resistance, R0(SOC,T) parameter of a cell in the module.
Check the dimension compatibility of the matrices with a zero deviation.
Module1.BatteryCapacityCellPercentDeviation = zeros(6,1);
Module1.R0ThermalCellPercentDeviation = zeros(42,3);
out = sim('DischargeDetailedModule');
plotSimResults(out);
The current, SOC, temperature, and voltage values overlap for all six cells because there is no deviation.
Next, introduce non-zero deviation. Specify a percent deviation for the first cell of the first parallel assembly such that is higher at low SOC values and lower at high SOC values.
Module1.R0ThermalCellPercentDeviation(1:7,:) = [
     5  5  5;
     3  3  3;
     1  1  1;
     0  0  0;
    -1 -1 -1;
    -2 -2 -2;
    -4 -4 -4];
Specify a percent deviation for the first cell of the second parallel assembly such that is higher at high temperature values and lower at low temperature values.
Module1.R0ThermalCellPercentDeviation(15:21,:) = [
    -10 -5 5;
    -10 -5 5;
    -10 -5 5;
    -10 -5 5;
    -10 -5 5;
    -10 -5 5;
    -10 -5 5];
Simulate the model and plot the results.
out = sim('DischargeDetailedModule');
plotSimResults(out);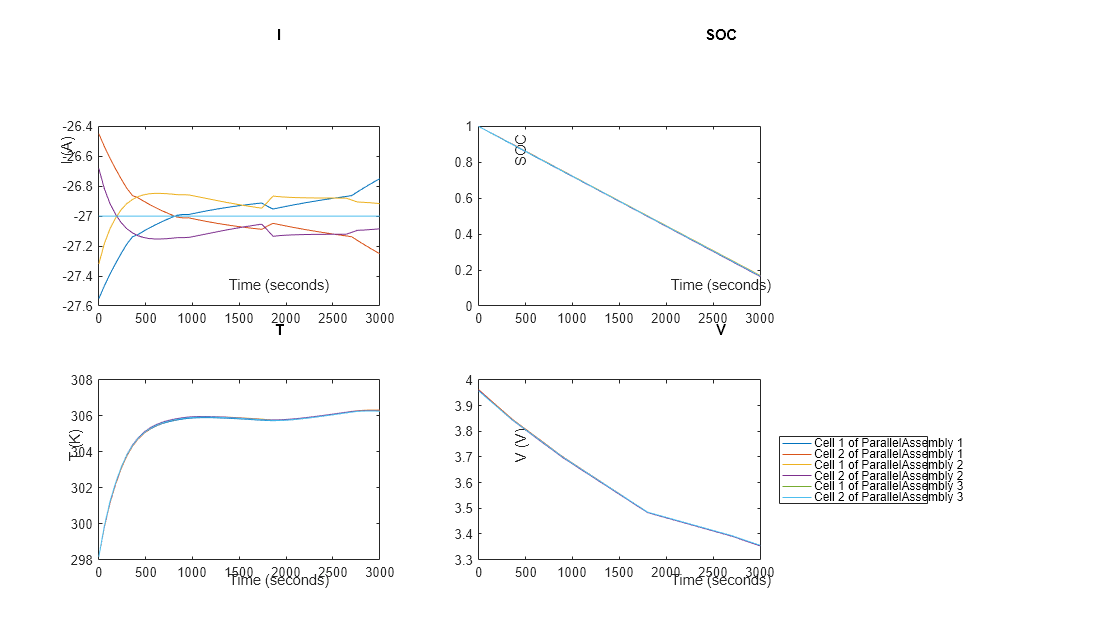
At the beginning of the simulation, when the battery is fully charged, the first cell of the first parallel assembly draws more current than the second cell of the first parallel assembly because of the lower resistance values, but draws less current later because of the higher resistance values.
Similarly, at the beginning of the simulation, the first cell of the second parallel assembly draws more current than the second cell of the second parallel assembly because of the lower resistance values when the temperature is at 298 K, but draws less current later because of the higher resistance value when the temperature is at 306 K.
See Also
Module (Generated
Block) | Module