batteryChart
Description
Use batteryChart to construct a battery chart for visualizing a
Simscape™
Battery™ object.
Note
The BatteryChart object stores an independent copy of the object it
displays and does not modify any of its properties.
The BatteryChart object displays the battery object according to the
global coordinate system for batteries:

To enable these labels in your chart, use the
setDefaultLabels function. For more information about setting labels,
see Set Labels for BatteryChart Object.
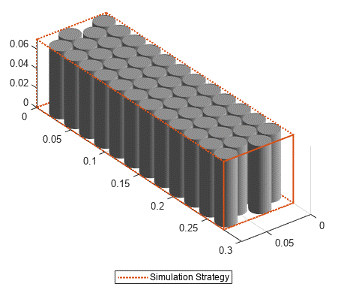
The BatteryChart object also allows you to check the current simulation
strategy and model resolution of the battery component. To visualize the simulation strategy
in the chart, set the SimulationStrategyVisible property to
"on" or click on the "Show/hide simulation strategy" button on
the top-right corner of the chart.
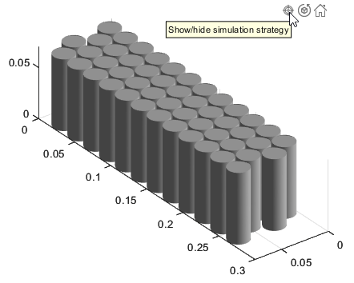
For example, if you set the ModelResolution property of a
ParallelAssembly object to "Lumped", the object
automatically scales the electrical parameters of the cell model blocks by using the
NumParallelCells property. This figure shows the simulation strategy
for a lumped parallel assembly:
Only one cell model block represents all the cell components inside the orange box.
If you set the ModelResolution property of a
ParallelAssembly object to "Grouped", a number
of cell model blocks equal to the value of the NumParallelCells property
represents each cell component instead.

Creation
Syntax
Description
chart = batteryChart(Battery)BatteryChart object that visualizes the battery object specified in the
Battery
property.
chart = batteryChart(___,Name=Value)
Properties
Container for the visualization of the battery, specified as a
Figure object or a Figure object created using the
uifigure function or one of its child
containers: Tab, Panel, ButtonGroup,
TiledChardLayout, or GridLayout.
Battery object to visualize, specified as a Cell,
ParallelAssembly, Module,
ModuleAssembly, or Pack object.
Option to visualize the axes of the chart, specified as
"on" or "off".
Direction of increasing values along the x-axis, specified as:
"normal"— Values increase outward from the center of the chart."reverse"— Values decrease outward from the center of the chart.
Direction of increasing values along the y-axis, specified as:
"normal"— Values increase outward from the center of the chart."reverse"— Values decrease outward from the center of the chart.
Direction of increasing values along the z-axis, specified as:
"normal"— Values increase outward from the center of the chart."reverse"— Values decrease outward from the center of the chart.
Visibility of the simulation strategy highlighted on the chart, specified as
"on" or "off".
Color of the line for the simulation strategy highlighted on the chart, specified as an RGB triplet, a hexadecimal color code, a color name, or a short name.
For a custom color, specify an RGB triplet or a hexadecimal color code.
An RGB triplet is a three-element row vector whose elements specify the intensities of the red, green, and blue components of the color. The intensities must be in the range
[0,1]; for example,[0.4 0.6 0.7].A hexadecimal color code is a character vector or a string scalar that starts with a hash symbol (
#) followed by three or six hexadecimal digits, which can range from0toF. The values are not case sensitive. Thus, the color codes'#FF8800','#ff8800','#F80', and'#f80'are equivalent.
Alternatively, you can specify some common colors by name. This table lists the named color options, the equivalent RGB triplets, and hexadecimal color codes.
| Color Name | Short Name | RGB Triplet | Hexadecimal Color Code | Appearance |
|---|---|---|---|---|
'red' | 'r' | [1 0 0] | '#FF0000' |
|
'green' | 'g' | [0 1 0] | '#00FF00' |
|
'blue' | 'b' | [0 0 1] | '#0000FF' |
|
'cyan'
| 'c' | [0 1 1] | '#00FFFF' |
|
'magenta' | 'm' | [1 0 1] | '#FF00FF' |
|
'yellow' | 'y' | [1 1 0] | '#FFFF00' |
|
'black' | 'k' | [0 0 0] | '#000000' |
|
'white' | 'w' | [1 1 1] | '#FFFFFF' |
|
'none' | Not applicable | Not applicable | Not applicable | No color |
Here are the RGB triplets and hexadecimal color codes for the default colors.
| RGB Triplet | Hexadecimal Color Code | Appearance |
|---|---|---|
[0 0.4470 0.7410] | '#0072BD' |
|
[0.8500 0.3250 0.0980] | '#D95319' |
|
[0.9290 0.6940 0.1250] | '#EDB120' |
|
[0.4940 0.1840 0.5560] | '#7E2F8E' |
|
[0.4660 0.6740 0.1880] | '#77AC30' |
|
[0.3010 0.7450 0.9330] | '#4DBEEE' |
|
[0.6350 0.0780 0.1840] | '#A2142F' |
|
Style of the line for the simulation strategy highlighted on the chart, specified as a character vector or string containing symbols.
Example: '--' is a dashed line
| Line Style | Description | Resulting Line |
|---|---|---|
'-' | Solid line |
|
'--' | Dashed line |
|
':' | Dotted line |
|
'-.' | Dash-dotted line |
|
Width of the line for the simulation strategy highlighted on the chart, specified as a positive value in points, where 1 point = 1/72 of an inch.
The line width cannot be thinner than the width of a pixel. If you set the line width to a value that is less than the width of a pixel on your system, the line displays as one pixel wide.
Color of light, specified as an RGB triplet, a hexadecimal color code, a color name,
or a short name. The default RGB triplet of [1 1 1] corresponds to
white.
RGB triplets and hexadecimal color codes are useful for specifying custom colors.
An RGB triplet is a three-element row vector whose elements specify the intensities of the red, green, and blue components of the color. The intensities must be in the range
[0,1]; for example,[0.4 0.6 0.7].A hexadecimal color code is a character vector or a string scalar that starts with a hash symbol (
#) followed by three or six hexadecimal digits, which can range from0toF. The values are not case sensitive. Thus, the color codes'#FF8800','#ff8800','#F80', and'#f80'are equivalent.
Alternatively, you can specify some common colors by name. This table lists the named color options, the equivalent RGB triplets, and hexadecimal color codes.
| Color Name | Short Name | RGB Triplet | Hexadecimal Color Code | Appearance |
|---|---|---|---|---|
'red' | 'r' | [1 0 0] | '#FF0000' |
|
'green' | 'g' | [0 1 0] | '#00FF00' |
|
'blue' | 'b' | [0 0 1] | '#0000FF' |
|
'cyan'
| 'c' | [0 1 1] | '#00FFFF' |
|
'magenta' | 'm' | [1 0 1] | '#FF00FF' |
|
'yellow' | 'y' | [1 1 0] | '#FFFF00' |
|
'black' | 'k' | [0 0 0] | '#000000' |
|
'white' | 'w' | [1 1 1] | '#FFFFFF' |
|
Here are the RGB triplets and hexadecimal color codes for the default colors.
| RGB Triplet | Hexadecimal Color Code | Appearance |
|---|---|---|
[0 0.4470 0.7410] | '#0072BD' |
|
[0.8500 0.3250 0.0980] | '#D95319' |
|
[0.9290 0.6940 0.1250] | '#EDB120' |
|
[0.4940 0.1840 0.5560] | '#7E2F8E' |
|
[0.4660 0.6740 0.1880] | '#77AC30' |
|
[0.3010 0.7450 0.9330] | '#4DBEEE' |
|
[0.6350 0.0780 0.1840] | '#A2142F' |
|
Example: 'green'
Type of light source, specified as:
'infinite'— Place the light at infinity. Use theLightPositionproperty to specify the direction from which the light shines in parallel rays.'local'— Place the light at the location specified by theLightPositionproperty. The light is a point source that radiates from the location in all directions.
Location of light source, specified as a three-element vector of the form
[x y z]. Define the vector elements in data units from the axes
origin to the (x, y, z)
coordinate. The actual location of the light depends on the value of the
LightStyle property.
Example: [-40 -4 140]
Visibility of light from light source, specified as 'on' or
'off', or as numeric or logical 1
(true) or 0 (false). A value
of 'on' is equivalent to true, and
'off' is equivalent to false. Thus, you can use
the value of this property as a logical value.
Examples
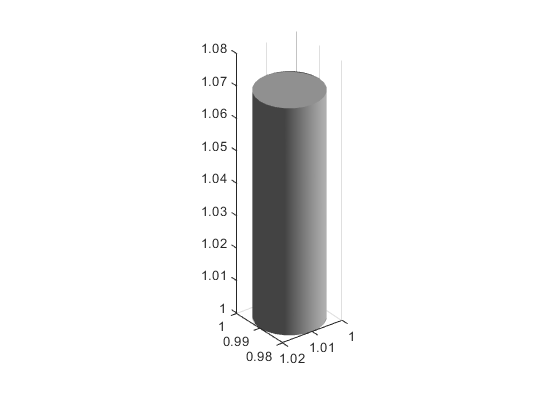
Create a cylindrical Cell object and modify its position.
cell = batteryCell(batteryCylindricalGeometry,Position=[1 1 1])
Use batteryChart to visualize the Cell
object.
cellChart = batteryChart(cell)
To set the labels for a BatteryChart object, follow the steps in
Visualize Cell Object with Cylindrical Geometry to create a
BatteryChart object and then use the
setDefaultLabels method.
cellChart.setDefaultLabels
Create a cylindrical Cell object.
cell = batteryCell(batteryCylindricalGeometry)
Create a Figure object using the uifigure
function and use batteryChart to visualize the Cell
object.
fig = uifigure;
batteryChart(fig,cell);
The Parent argument of the BatteryChart object
can also be a child container of the uifigure function, such as the
GridLayout object. Use the uigridlayout function to create a grid layout in a new figure.
fig = uifigure('Position',[100 100 440 320]);
g = uigridlayout(fig);
g.RowHeight = {220,220,'1x'};
g.ColumnWidth = {1500,'1x'};
Add a drop-down component in the first row of the grid.
dd1 = uidropdown(g);
dd1.Items = {'Select a device'};
Visualize the Cell object in the second row of the
grid.
dd2 = batteryChart(g,myCell);
dd2.Layout.Row = 2;
dd2.Layout.Column = 1;
Version History
Introduced in R2022b