simscape.logging.plot
Plot logged simulation data for Node or Series
Description
fh = simscape.logging.plot(logobject)y-axis, with time
along the x-axis. logobject is a
simscape.logging.Node or simscape.logging.Series object,
or a homogeneous cell array of such objects. If logobject is a node,
the function plots all nonempty series associated with the specified node and its children.
Depending on the type of logobj, fh is a structure
(for a node) or a cell array (for a series) of handles to the resulting figures.
fh = simscape.logging.plot(logobject,Name,Value)Name,Value
pair arguments. For example, specify 'units' followed by a unit name to
plot only nodes and series that are commensurate with the specified unit.
Examples
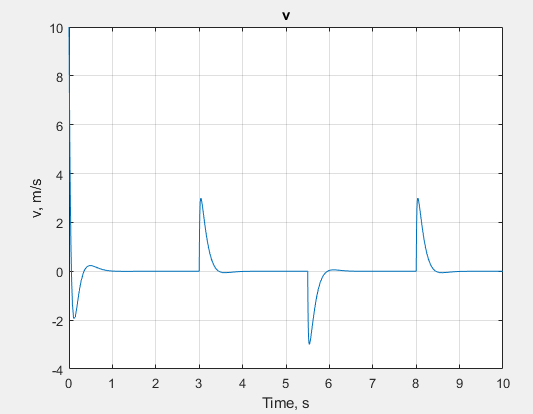
Plot velocity of port R of a Translational Spring block.
Open the Mass-Spring-Damper with Controller example model:
openExample('simscape/MassSpringDamperWithControllerExample')This example model has data logging enabled for the whole model, with the
Workspace variable name parameter set to
simlog_MassSpringDamperWithController.
Simulate the model to log the simulation data:
sim('MassSpringDamperWithController');Plot velocity of port R of the Translational
Spring block Spring.
simscape.logging.plot(simlog_MassSpringDamperWithController.Spring.R);
Use the name-value pair arguments to filter simulation data being plotted.
For a model with the default workspace variable name, simlog,
plot only linear positions and velocities (series that are commensurate with units of
mm and mm/s), in those units, for the top-level
model node, its children and their children, within the time range between 1 and 3
seconds:
fh = simscape.logging.plot(simlog,'units',{'mm','mm/s'},'time',[1 3],'depth',2);
Use the workspace variable name simlog1 to log the
data from the first run, and the workspace variable name simlog2 to log
the data from the second run.
Plot deformation of the Translational Spring block
TS from both runs on the same axis, with the corresponding
legend.
simscape.logging.plot({simlog1.TS.x simlog2.TS.x},'names',{'Run1' 'Run2'});
Input Arguments
Name-Value Arguments
Output Arguments
Version History
Introduced in R2010b