Simulink.sdi.getCursorPositions
Get position for active cursors in the Simulation Data Inspector
Syntax
Description
t1 = Simulink.sdi.getCursorPositions
Examples
You can use the Simulation Data Inspector programmatic interface to specify the position of cursors on time plots or sparklines and to access the time that corresponds to the current cursor position.
Suppose you want to know the signal values 5 seconds into
the simulation. Use the Simulink.sdi.setCursorPositions
function to move the cursor to t=5s and read the signal
values off from the cursor on each subplot. The asterisk next to the value in
the cursor label indicates that the value is interpolated because the simulation
did not include a calculation for a simulation time of exactly
5s.
Simulink.sdi.setCursorPositions('left',5);
Suppose you want to calculate the time between two peaks in the
x2 signal. Add a second cursor using the
Simulink.sdi.setNumCursors function or by using
Show/hide data cursors ![]() in the Simulation Data Inspector.
in the Simulation Data Inspector.
numCursors = Simulink.sdi.getNumCursors;
if(numCursors < 2)
    Simulink.sdi.setNumCursors(2);
end
Drag the cursors so the left cursor is positioned at the first peak in the
x2 signal and the right cursor is positioned at the
second peak. Alternatively, you can run this code that positions the cursors for
you.
Simulink.sdi.setCursorPositions('left',5.921998549931304,...
    'right',12.378442136906246);
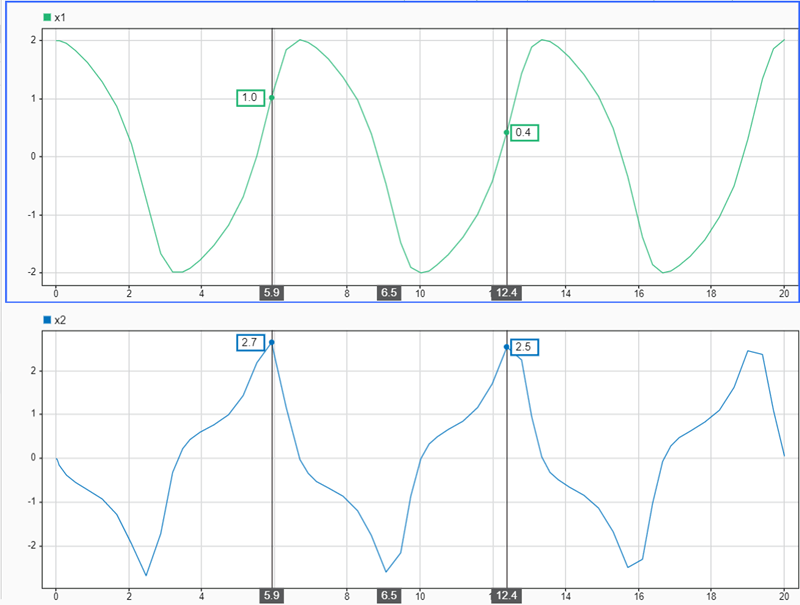
The Simulation Data Inspector displays the difference between the two cursors
in seconds. However, the cursor position and difference values are both rounded.
Use the Simulink.sdi.getCursorPositions function to
programmatically retrieve the exact time values that correspond to the cursor
positions. Then, compute the difference between the times.
[t1,t2] = Simulink.sdi.getCursorPositions;
T = t2 - t1
T = 6.4564
Input Arguments
Output Arguments
Version History
Introduced in R2021a