Create Interactive Comparison Reports
This example shows how to create an interactive web-based comparison report to share and archive results for comparisons you perform using the Simulation Data Inspector. You can use the report to analyze the comparison results similarly to how you would in the Simulation Data Inspector. You can change the layout of the report between the interactive view and a printable view.
By default, the Simulation Data Inspector saves the report with the filename New_Report.html in a folder called sdireports in the working directory. The software also creates a folder with the same name as the HTML file that contains the data needed to generate the HTML file. To share the report, include both the HTML file and the corresponding report folder. Viewing the report requires only a web browser.

This example uses data loaded into the Simulation Data Inspector from a session file. For more information about importing data into the Simulation Data Inspector, see Import Data from Workspace or File into Simulation Data Inspector.
Load and Compare Data
Open the Simulation Data Inspector and load the session file.
Simulink.sdi.view
Simulink.sdi.clear;
Simulink.sdi.load("dataToCompare.mldatx");
The session file contains data created by simulating the model slexAircraftExample. Both simulations use the square wave input from the Pilot block in the model. Each simulation uses a different time constant for the input filter. The first run contains simulation results for an input filter time constant of 0.1. The second run contains simulation results for an input filter time constant of 1.
To analyze the effect of changing the input filter time constant, compare the runs that contain the data for each simulation.
In the Simulation Data Inspector, navigate to the Compare tab.
From the Baseline list, select
Run 1: slexAircraftExample.From the Compare to list, select
Run 2: slexAircraftExample.Click Compare.
Alternatively, you can compare the runs programmatically using the Simulink.sdi.compareRuns function.
runIDs = Simulink.sdi.getAllRunIDs;
runID1 = runIDs(end-1);
runID2 = runIDs(end);

diffRes = Simulink.sdi.compareRuns(runID1,runID2);
Generate Interactive Comparison Report
When you generate a comparison report to save the comparison results, specify:
The data you want to include in the report.
The title and author for the report.
The filename and location.
Options for avoiding overwriting existing reports and shortening block paths. Consider shortening block paths when you log data throughout a model hierarchy.
To create the report, click Report ![]() .
.
For this example:
In the File text box, enter the folder path followed by the filename
slexAircraft_filterCompare.html.In the Title text box, enter
Compare: Ts = 0.1 vs. Ts = 1.Under Content, select either option. In this example, all signals in the comparison do not match, so the contents of the report are the same for either option.
Click Create.
The generated report automatically opens in the system browser.
Inspect Comparison Results Using Interactive Report
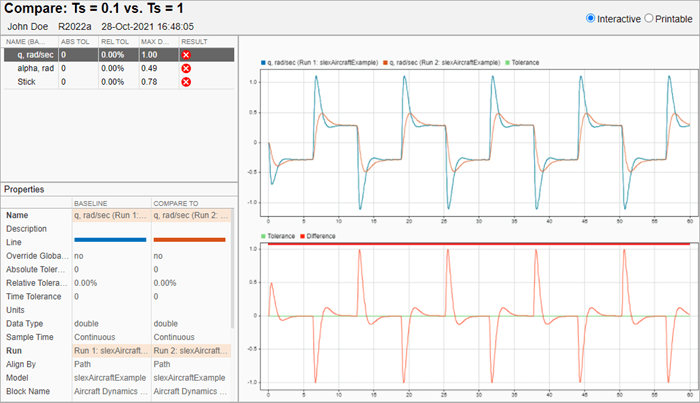
The interactive report information and layout is similar to what you see on the Compare pane of the Simulation Data Inspector. In the comparisons table, you can select the signal result you want to view in the plots.

The Properties table shows the metadata for the compared signals and highlights metadata that differs. Scroll in the Properties table to see all the metadata. When the comparison contains more signals than fit in the results table, you can scroll in the comparison table to inspect the results for each signal comparison and sort the signals in the table by the data in each column. You can also adjust the size of the panes in the report by dragging the borders and adjust the width of the columns in each table by dragging the divisions between the column headings.
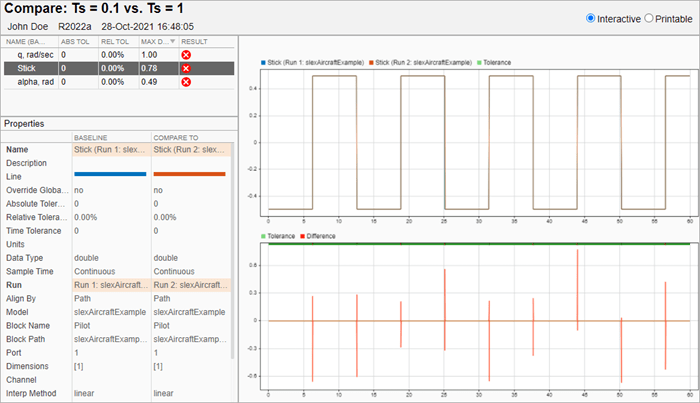
For example, to sort the results by the maximum difference, click the Max Diff column.

Zoom, Pan, and Use Cursors in Interactive Plots
Since R2025b
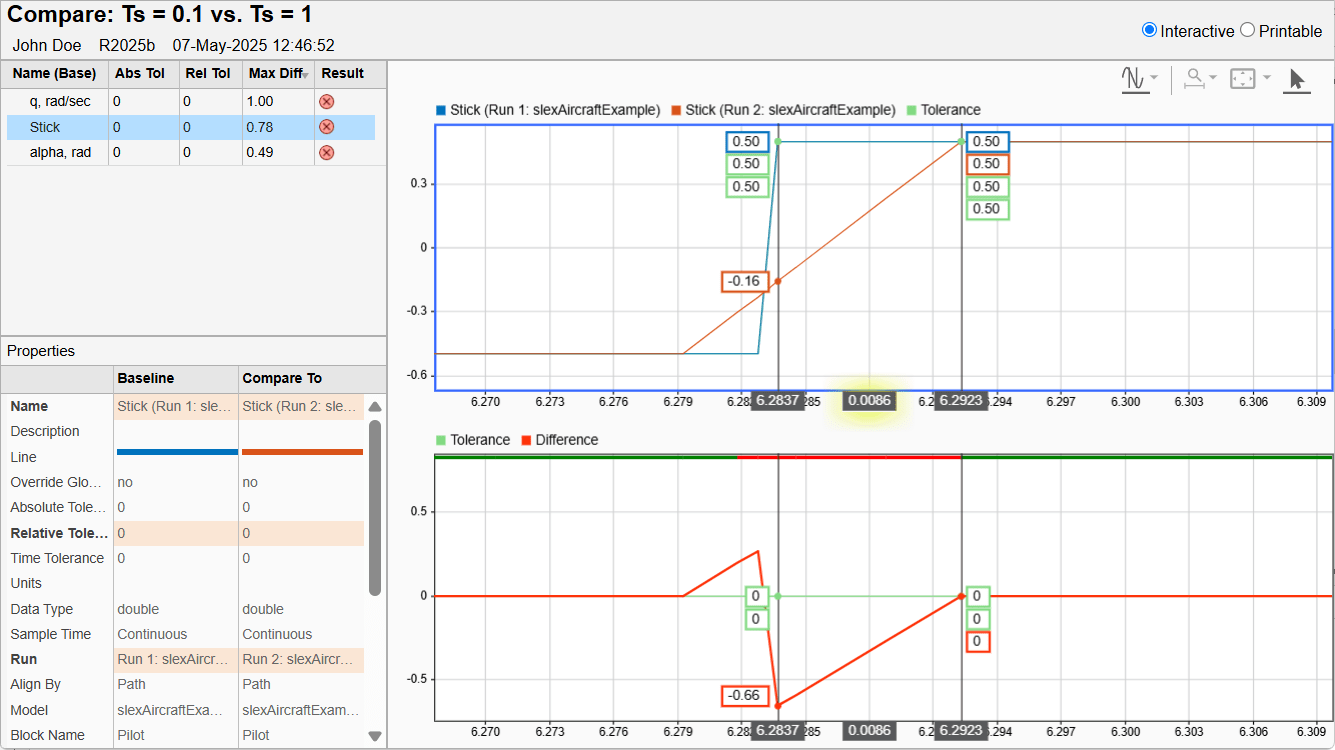
The information in the table indicates that the comparison results for the Stick signal are out of tolerance with a maximum difference of 0.78. In the model, the Stick signal is the output from a Signal Generator block, and the filter time constant should not affect the block output. Select the Stick signal to investigate the comparison results.
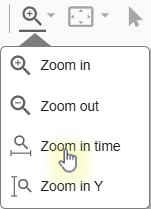
The plot shows that the differences occur at the rising and falling edges of the square wave. Select Zoom in time to zoom in on one of the rising edges.
The slexAircraftExample model uses a variable-step solver. The differences occur because the new time constant value changes the system dynamics, and the solver calculates slightly different time steps for the second simulation. The transition of the square wave is sharp, so small timing differences can result in large differences in magnitude.
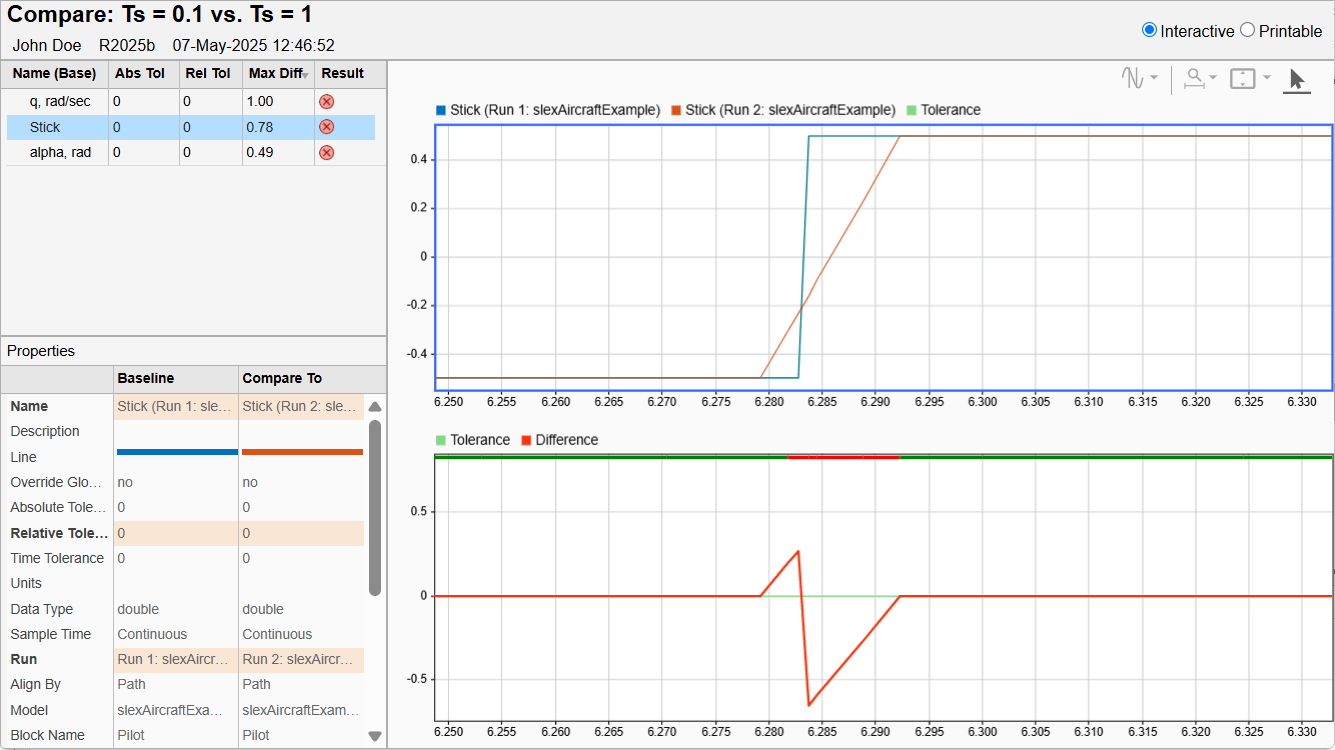
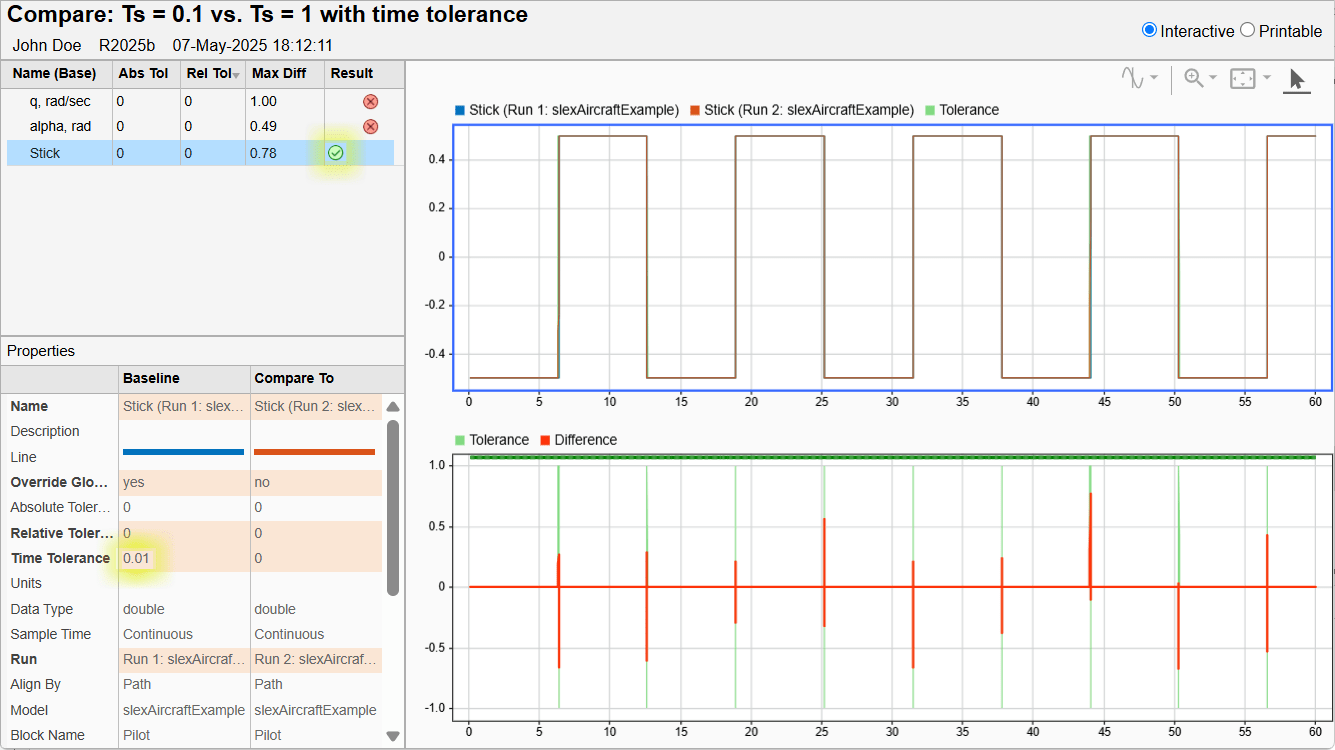
Because the differences in the Stick signal are due to modeling rather than a real change in system dynamics, you could specify a small time tolerance for the Stick signal in the Simulation Data Inspector so the comparison results are within tolerance. To find an appropriate tolerance value to use, add two cursors to the plot.
Place one cursor at the point where the Stick signal from the first run hits the peak of the square wave. Place the second cursor at the time point where the Stick signal from the second run hits the peak. Use the difference between the two cursors to estimate a time tolerance to apply to the Stick signal.
To share the updated results, generate a new comparison report. For more information about comparing signals, including applying relative, absolute, and time tolerances, see Compare Simulation Data.
Print Comparison Report
After finalizing the analysis and presentation of the comparison results, you can print a comprehensive view of the results using the interactive web report. To switch to the printable view, select the Printable radio button, or press Ctrl+P to see a print preview in the browser. In the printable view, the metadata and plots for all signals are stacked using the original zoom level with no cursors, with the summary table at the top.