La traduction de cette page n'est pas à jour. Cliquez ici pour voir la dernière version en anglais.
Exécution dans MATLAB
Concevez une logique avec des diagrammes d’états et exécutez-la sous forme de programmes MATLAB. Exécutez votre diagramme et réalisez des tests unitaires dans l’éditeur Stateflow. Contrôlez le comportement des interfaces utilisateur et des applications de traitement de données avec votre diagramme.
Fonctions
Syntaxe Stateflow
Rubriques
- Create Stateflow Charts for Execution as MATLAB Objects
Save standalone Stateflow charts outside of Simulink® models.
- Execute and Unit Test Stateflow Chart Objects
Run Stateflow charts in MATLAB or through the Stateflow Editor.
- Execute Stateflow Chart Objects Through Scripts and Models
Create a MATLAB script or a Simulink model that invokes a standalone Stateflow chart.
- Conversion d’un code MATLAB en diagrammes de flux Stateflow
Produisez des diagrammes de flux à partir de votre code MATLAB.
Résolution des problèmes
Debug a Standalone Stateflow Chart
Interrupt execution to step through each action in a Stateflow chart.
Informations connexes
Sélection d՚exemples
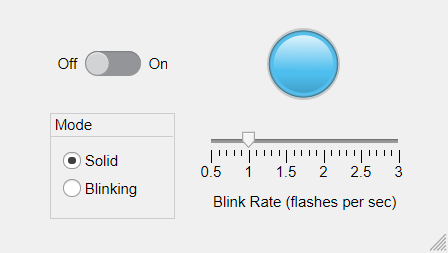
Concevoir une logique d’interface homme-machine à l’aide de diagrammes Stateflow
Modéliser la logique d’une application de lampe dans un diagramme Stateflow autonome.

Model a Communications Protocol by Using Chart Objects
Use a standalone Stateflow® chart to model a frame-synchronization and symbol-detection component in a communications system. Standalone charts implement classic chart semantics with MATLAB® as the action language. You can program the chart by using the full functionality of MATLAB, including those functions that are restricted for code generation in Simulink®. For more information, see Create Stateflow Charts for Execution as MATLAB Objects.

Implement a Financial Strategy by Using Stateflow
Use a standalone Stateflow® chart to model a financial trading strategy known as Bollinger Bands. Standalone charts implement classic chart semantics with MATLAB® as the action language. You can program the chart by using the full functionality of MATLAB, including those functions that are restricted for code generation in Simulink®. For more information, see Create Stateflow Charts for Execution as MATLAB Objects.

Model a Fitness App by Using Standalone Charts
Implement a fitness tracker by using multiple standalone charts and a MATLAB app.

Model Bluetooth Low Energy Link Layer Using Stateflow
Use a standalone Stateflow chart to model the state machine in a Bluetooth® low energy link layer.
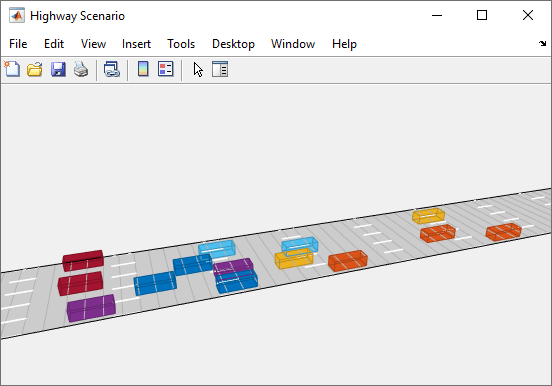
Automate Control of Intelligent Vehicles by Using Stateflow Charts
Model a highway scenario with intelligent vehicles that are controlled by the same decision logic.
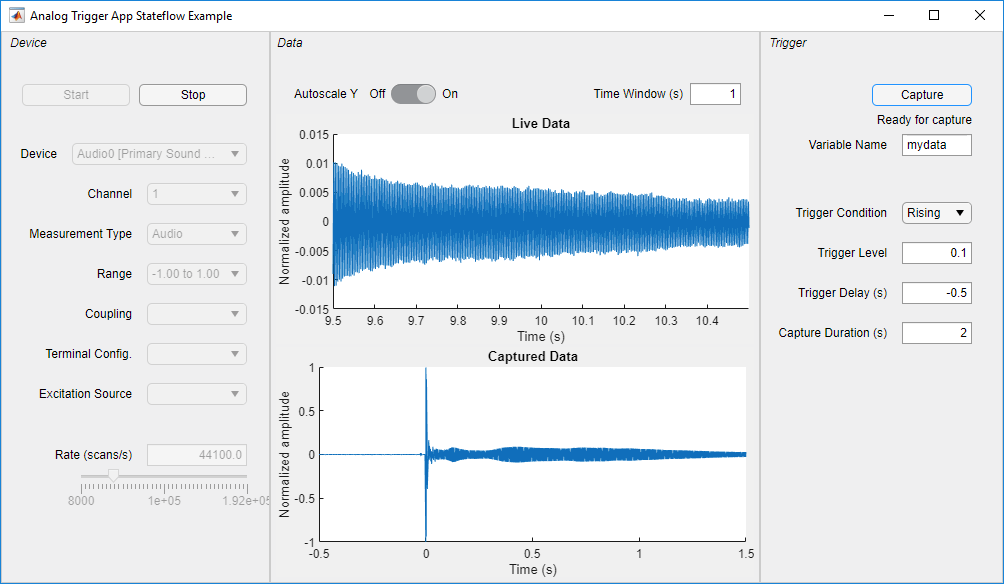
Analog Triggered Data Acquisition Using Stateflow Charts
Create an analog-triggered data acquisition app by using Stateflow, Data Acquisition Toolbox™, and App Designer.

Pick-and-Place Workflow Using Stateflow for MATLAB
Design a pick-and-place workflow for a robotic manipulator such as Kinova® Gen3 using Stateflow.