Best Practices for Using Complex Data in C Charts
Complex data is data whose value is a complex number. For example, in a Stateflow® chart in Simulink® model, an input signal with the value 3 + 5i is
complex. See Complex Data in Stateflow Charts.
When you use complex data in Stateflow charts that use C as the action language, follow these best practices.
Perform Math Function Operations with a MATLAB Function
Math functions such as sin, cos,
min, max, and abs
do not work with complex data in C charts. However, you can use a MATLAB® function in your chart to perform math function operations on complex
data.
A Simple Example
In the following chart, a MATLAB function calculates the absolute value of a complex number:
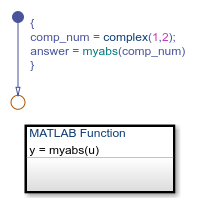
The value of comp_num is 1+2i.
Calculating the absolute value gives an answer of
2.2361.
How to Calculate Absolute Value
Suppose that you want to find the absolute value of a complex number. Follow these steps:
Add a MATLAB function to your chart with this signature:
y = myabs(u)
Double-click the function box to open the editor.
In the editor, enter the code below:
function y = myabs(u)
%#codegen
y = abs(u);
The function
myabstakes a complex inputuand returns the absolute value as an outputy.Configure the input argument
uto accept complex values.Open the Model Explorer.
In the Model Hierarchy pane of the Model Explorer, navigate to the MATLAB function
myabs.In the Contents pane of the Model Explorer, right-click the input argument
uand select Properties from the context menu.In the Data properties dialog box, select
Onin the Complexity field and click OK.
You cannot pass real values to function inputs of complex type. For details, see Rules for Using Complex Data in C Charts.
Perform Complex Division with a MATLAB Function
Division with complex operands is not available as a binary or assignment operation in C charts. However, you can use a MATLAB function in your chart to perform division on complex data.
A Simple Example
In the following chart, a MATLAB function performs division on two complex operands:
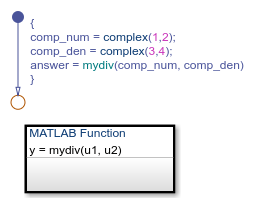
The values of comp_num and comp_den are
1+2i and 3+4i, respectively. Dividing
these values gives an answer of 0.44+0.08i.
How to Perform Complex Division
To divide two complex numbers:
Add a MATLAB function to your chart with this function signature:
y = mydiv(u1, u2)
Double-click the function box to open the editor.
In the editor, enter the code below:
function y = mydiv(u1, u2)
%#codegen
y = u1 / u2;
The function
mydivtakes two complex inputs,u1andu2, and returns the complex quotient of the two numbers as an outputy.Configure the input and output arguments to accept complex values.
Open the Model Explorer.
In the Model Hierarchy pane of the Model Explorer, navigate to the MATLAB function
mydiv.For each input and output argument, follow these steps:
In the Contents pane of the Model Explorer, right-click the argument and select Properties from the context menu.
In the Data properties dialog box, select
Onin the Complexity field and click OK.
You cannot pass real values to function inputs of complex type. For details, see Rules for Using Complex Data in C Charts.
Rules for Using Complex Data in C Charts
Complex data is data whose value is a complex number. For example, in a
Stateflow chart in Simulink model, an input signal with the value 3 + 5i is
complex. See Complex Data in Stateflow Charts.
These rules apply when you use complex data in Stateflow charts that use C as the action language.
![]() Do not use complex number notation in actions
Do not use complex number notation in actions
![]() Do not perform math function operations on complex data in C charts
Do not perform math function operations on complex data in C charts
![]() Mix complex and real operands only for addition, subtraction, and
multiplication
Mix complex and real operands only for addition, subtraction, and
multiplication
![]() Do not define complex data with
Do not define complex data with ml,
struct, or boolean base type
![]() Use only real values to set initial values of complex data
Use only real values to set initial values of complex data
![]() Do not enter minimum or maximum values for complex data
Do not enter minimum or maximum values for complex data
![]() Assign complex values only to data of complex type
Assign complex values only to data of complex type