predictObjective
Predict objective function at a set of points
Syntax
Description
Examples
This example shows how to estimate the cross-validation loss of an optimized classifier.
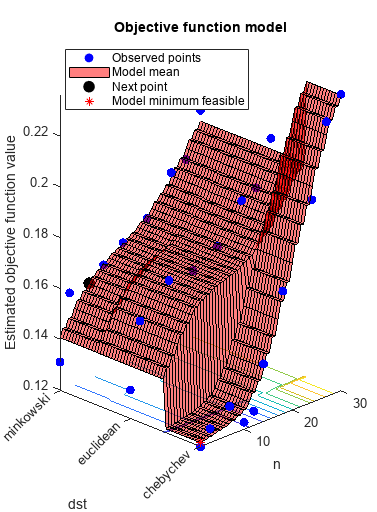
Optimize a KNN classifier for the ionosphere data, meaning find parameters that minimize the cross-validation loss. Minimize over nearest-neighborhood sizes from 1 to 30, and over the distance functions 'chebychev', 'euclidean', and 'minkowski'.
For reproducibility, set the random seed, and set the AcquisitionFunctionName option to 'expected-improvement-plus'.
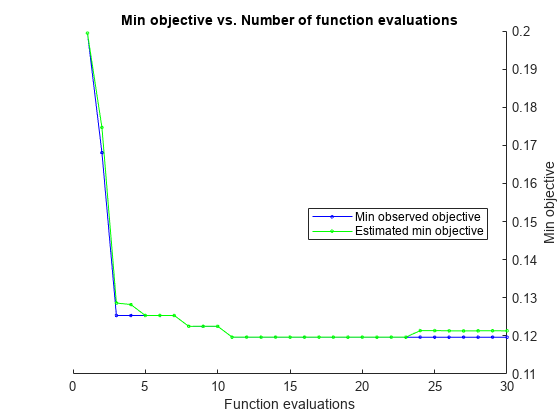
load ionosphere rng default num = optimizableVariable('n',[1,30],'Type','integer'); dst = optimizableVariable('dst',{'chebychev','euclidean','minkowski'},'Type','categorical'); c = cvpartition(351,'Kfold',5); fun = @(x)kfoldLoss(fitcknn(X,Y,'CVPartition',c,'NumNeighbors',x.n,... 'Distance',char(x.dst),'NSMethod','exhaustive')); results = bayesopt(fun,[num,dst],'Verbose',0,... 'AcquisitionFunctionName','expected-improvement-plus');
Create a table of points to estimate.
b = categorical({'chebychev','euclidean','minkowski'});
n = [1;1;1;4;2;2];
dst = [b(1);b(2);b(3);b(1);b(1);b(3)];
XTable = table(n,dst);Estimate the objective and standard deviation of the objective at these points.
[objective,sigma] = predictObjective(results,XTable); [XTable,table(objective,sigma)]
ans=6×4 table
    n       dst       objective      sigma
    _    _________    _________    _________

    1    chebychev     0.12132     0.0068029
    1    euclidean     0.14052     0.0079128
    1    minkowski     0.14057     0.0079117
    4    chebychev      0.1227     0.0068805
    2    chebychev     0.12176     0.0066739
    2    minkowski      0.1437     0.0075448