predictObjectiveEvaluationTime
Predict objective function run times at a set of points
Description
Examples
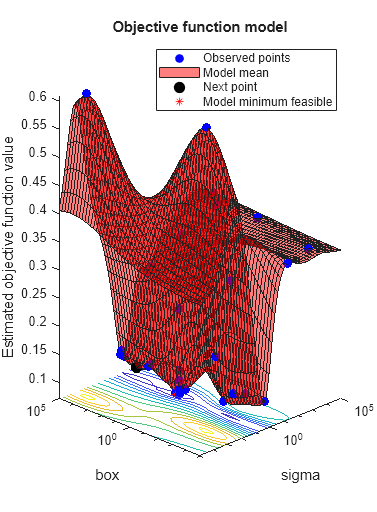
This example shows how to estimate the objective function evaluation time in an optimized Bayesian model of SVM classification.
Create an optimized SVM model. For details of this model, see Optimize Cross-Validated Classifier Using bayesopt.
rng default
grnpop = mvnrnd([1,0],eye(2),10);
redpop = mvnrnd([0,1],eye(2),10);
redpts = zeros(100,2);
grnpts = redpts;
for i = 1:100
    grnpts(i,:) = mvnrnd(grnpop(randi(10),:),eye(2)*0.02);
    redpts(i,:) = mvnrnd(redpop(randi(10),:),eye(2)*0.02);
end
cdata = [grnpts;redpts];
grp = ones(200,1);
grp(101:200) = -1;
c = cvpartition(200,'KFold',10);
sigma = optimizableVariable('sigma',[1e-5,1e5],'Transform','log');
box = optimizableVariable('box',[1e-5,1e5],'Transform','log');
minfn = @(z)kfoldLoss(fitcsvm(cdata,grp,'CVPartition',c,...
    'KernelFunction','rbf','BoxConstraint',z.box,...
    'KernelScale',z.sigma));
results = bayesopt(minfn,[sigma,box],'IsObjectiveDeterministic',true,...
    'AcquisitionFunctionName','expected-improvement-plus','Verbose',0);
Predict the evaluation time for various points.
sigma = logspace(-5,5,11)';
box = 1e5*ones(size(sigma));
XTable = table(sigma,box);
time = predictObjectiveEvaluationTime(results,XTable);
[XTable,table(time)]
ans=11×3 table
    sigma      box       time
    ______    _____    ________

     1e-05    1e+05     0.05486
    0.0001    1e+05    0.066241
     0.001    1e+05    0.052052
      0.01    1e+05    0.033793
       0.1    1e+05    0.029295
         1    1e+05     0.11835
        10    1e+05     0.71417
       100    1e+05     0.19139
      1000    1e+05    0.024345
     10000    1e+05    0.025948
     1e+05    1e+05    0.026074