Main Content

predict

Predict labels for Gaussian kernel classification model

Description

example

Label = predict(Mdl,X) returns a vector of predicted class labels for the predictor data in the matrix or table X, based on the binary Gaussian kernel classification model Mdl.

example

[Label,Score] = predict(Mdl,X) also returns classification scores for both classes.

Examples

collapse all

Predict the training set labels using a binary kernel classification model, and display the confusion matrix for the resulting classification.

Load the ionosphere data set. This data set has 34 predictors and 351 binary responses for radar returns, either bad ('b') or good ('g').

load ionosphere

Train a binary kernel classification model that identifies whether the radar return is bad ('b') or good ('g').

rng('default') % For reproducibility
Mdl = fitckernel(X,Y);

Mdl is a ClassificationKernel model.

Predict the training set, or resubstitution, labels.

label = predict(Mdl,X); 

Construct a confusion matrix.

ConfusionTrain = confusionchart(Y,label);

Figure contains an object of type ConfusionMatrixChart.

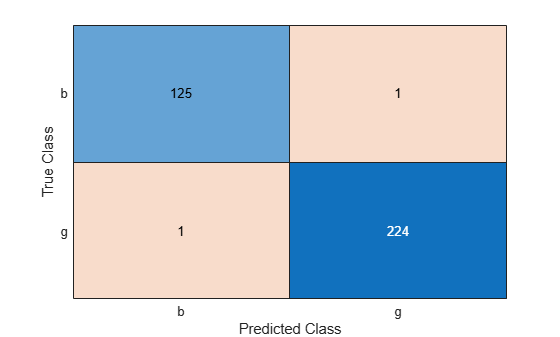
The model misclassifies one radar return for each class.

Predict the test set labels using a binary kernel classification model, and display the confusion matrix for the resulting classification.

Load the ionosphere data set. This data set has 34 predictors and 351 binary responses for radar returns, either bad ('b') or good ('g').

load ionosphere

Partition the data set into training and test sets. Specify a 15% holdout sample for the test set.

rng('default') % For reproducibility
Partition = cvpartition(Y,'Holdout',0.15);
trainingInds = training(Partition); % Indices for the training set
testInds = test(Partition); % Indices for the test set

Train a binary kernel classification model using the training set. A good practice is to define the class order.

Mdl = fitckernel(X(trainingInds,:),Y(trainingInds),'ClassNames',{'b','g'}); 

Predict the training-set labels and the test set labels.

labelTrain = predict(Mdl,X(trainingInds,:));
labelTest = predict(Mdl,X(testInds,:));

Construct a confusion matrix for the training set.

ConfusionTrain = confusionchart(Y(trainingInds),labelTrain);

Figure contains an object of type ConfusionMatrixChart.

The model misclassifies only one radar return for each class.

Construct a confusion matrix for the test set.

ConfusionTest = confusionchart(Y(testInds),labelTest);

Figure contains an object of type ConfusionMatrixChart.

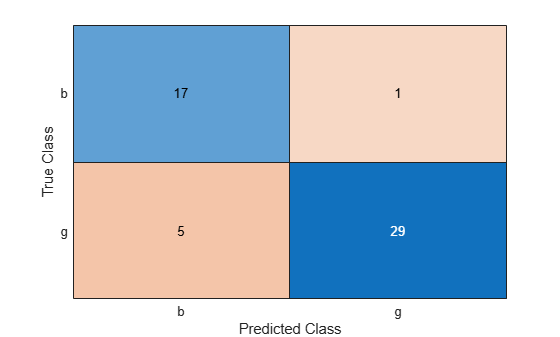
The model misclassifies one bad radar return as being a good return, and five good radar returns as being bad returns.

Estimate posterior class probabilities for a test set, and determine the quality of the model by plotting a receiver operating characteristic (ROC) curve. Kernel classification models return posterior probabilities for logistic regression learners only.

Load the ionosphere data set. This data set has 34 predictors and 351 binary responses for radar returns, either bad ('b') or good ('g').

load ionosphere

Partition the data set into training and test sets. Specify a 30% holdout sample for the test set.

rng('default') % For reproducibility
Partition = cvpartition(Y,'Holdout',0.30);
trainingInds = training(Partition); % Indices for the training set
testInds = test(Partition); % Indices for the test set

Train a binary kernel classification model. Fit logistic regression learners.

Mdl = fitckernel(X(trainingInds,:),Y(trainingInds), ...
    'ClassNames',{'b','g'},'Learner','logistic');

Predict the posterior class probabilities for the test set.

[~,posterior] = predict(Mdl,X(testInds,:));

Because Mdl has one regularization strength, the output posterior is a matrix with two columns and rows equal to the number of test-set observations. Column i contains posterior probabilities of Mdl.ClassNames(i) given a particular observation.

Compute the performance metrics (true positive rates and false positive rates) for a ROC curve and find the area under the ROC curve (AUC) value by creating a rocmetrics object.

rocObj = rocmetrics(Y(testInds),posterior,Mdl.ClassNames);

Plot the ROC curve for the second class by using the plot function of rocmetrics.

plot(rocObj,ClassNames=Mdl.ClassNames(2))

Figure contains an axes object. The axes object with title ROC Curve, xlabel False Positive Rate, ylabel True Positive Rate contains 3 objects of type roccurve, scatter, line. These objects represent g (AUC = 0.9042), g Model Operating Point.

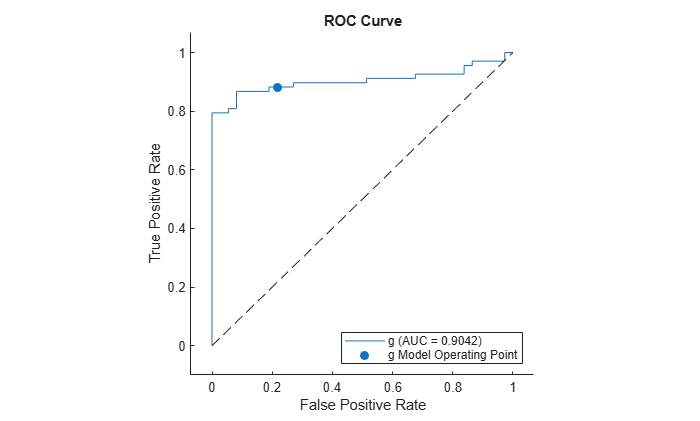
The AUC is close to 1, which indicates that the model predicts labels well.

Input Arguments

collapse all

Binary kernel classification model, specified as a ClassificationKernel model object. You can create a ClassificationKernel model object using fitckernel.

Predictor data to be classified, specified as a numeric matrix or table.

Each row of X corresponds to one observation, and each column corresponds to one variable.

  • For a numeric matrix:

    • The variables in the columns of X must have the same order as the predictor variables that trained Mdl.

    • If you trained Mdl using a table (for example, Tbl) and Tbl contains all numeric predictor variables, then X can be a numeric matrix. To treat numeric predictors in Tbl as categorical during training, identify categorical predictors by using the CategoricalPredictors name-value pair argument of fitckernel. If Tbl contains heterogeneous predictor variables (for example, numeric and categorical data types) and X is a numeric matrix, then predict throws an error.

  • For a table:

    • predict does not support multicolumn variables or cell arrays other than cell arrays of character vectors.

    • If you trained Mdl using a table (for example, Tbl), then all predictor variables in X must have the same variable names and data types as those that trained Mdl (stored in Mdl.PredictorNames). However, the column order of X does not need to correspond to the column order of Tbl. Also, Tbl and X can contain additional variables (response variables, observation weights, and so on), but predict ignores them.

    • If you trained Mdl using a numeric matrix, then the predictor names in Mdl.PredictorNames and corresponding predictor variable names in X must be the same. To specify predictor names during training, see the PredictorNames name-value pair argument of fitckernel. All predictor variables in X must be numeric vectors. X can contain additional variables (response variables, observation weights, and so on), but predict ignores them.

Data Types: table | double | single

Output Arguments

collapse all

Predicted class labels, returned as a categorical or character array, logical or numeric matrix, or cell array of character vectors.

Label has n rows, where n is the number of observations in X, and has the same data type as the observed class labels (Y) used to train Mdl. (The software treats string arrays as cell arrays of character vectors.)

The predict function classifies an observation into the class yielding the highest score. For an observation with NaN scores, the function classifies the observation into the majority class, which makes up the largest proportion of the training labels.

Classification scores, returned as an n-by-2 numeric array, where n is the number of observations in X. Score(i,j) is the score for classifying observation i into class j. Mdl.ClassNames stores the order of the classes.

If Mdl.Learner is 'logistic', then classification scores are posterior probabilities.

More About

collapse all

Classification Score

For kernel classification models, the raw classification score for classifying the observation x, a row vector, into the positive class is defined by

f(x)=T(x)β+b.

  • T(·) is a transformation of an observation for feature expansion.

  • β is the estimated column vector of coefficients.

  • b is the estimated scalar bias.

The raw classification score for classifying x into the negative class is f(x). The software classifies observations into the class that yields a positive score.

If the kernel classification model consists of logistic regression learners, then the software applies the 'logit' score transformation to the raw classification scores (see ScoreTransform).

Extended Capabilities

Version History

Introduced in R2017b

expand all