predictorImportance
Estimates of predictor importance for classification tree
Description
imp = predictorImportance(tree)tree by summing changes in
the risk due to splits on every predictor and dividing the sum by the number of branch
nodes. imp is returned as a row vector with the same number of elements
as tree.PredictorNames. The entries of imp are
estimates of the predictor importance, with 0 representing the smallest
possible importance.
Examples
Load Fisher's iris data set.
load fisheririsGrow a classification tree.
Mdl = fitctree(meas,species);
Compute predictor importance estimates for all predictor variables.
imp = predictorImportance(Mdl)
imp = 1×4

         0         0    0.0907    0.0682
The first two elements of imp are zero. Therefore, the first two predictors do not enter into Mdl calculations for classifying irises.
Estimates of predictor importance do not depend on the order of predictors if you use surrogate splits, but do depend on the order if you do not use surrogate splits.
Permute the order of the data columns in the previous example, grow another classification tree, and then compute predictor importance estimates.
measPerm  = meas(:,[4 1 3 2]);
MdlPerm = fitctree(measPerm,species);
impPerm = predictorImportance(MdlPerm)
impPerm = 1×4

    0.1515         0    0.0074         0
The estimates of predictor importance are not a permutation of imp.
Load Fisher's iris data set.
load fisheririsGrow a classification tree. Specify usage of surrogate splits.
Mdl = fitctree(meas,species,'Surrogate','on');
Compute predictor importance estimates for all predictor variables.
imp = predictorImportance(Mdl)
imp = 1×4

    0.0791    0.0374    0.1530    0.1529
All predictors have some importance. The first two predictors are less important than the final two.
Permute the order of the data columns in the previous example, grow another classification tree specifying usage of surrogate splits, and then compute predictor importance estimates.
measPerm  = meas(:,[4 1 3 2]);
MdlPerm = fitctree(measPerm,species,'Surrogate','on');
impPerm = predictorImportance(MdlPerm)
impPerm = 1×4

    0.1529    0.0791    0.1530    0.0374
The estimates of predictor importance are a permutation of imp.
Load the census1994 data set. Consider a model that predicts a person's salary category given their age, working class, education level, martial status, race, sex, capital gain and loss, and number of working hours per week.
load census1994
X = adultdata(:,{'age','workClass','education_num','marital_status','race',...
    'sex','capital_gain','capital_loss','hours_per_week','salary'});
Display the number of categories represented in the categorical variables using summary.
summary(X)
X: 32561×10 table

Variables:

    age: double
    workClass: categorical (8 categories)
    education_num: double
    marital_status: categorical (7 categories)
    race: categorical (5 categories)
    sex: categorical (2 categories)
    capital_gain: double
    capital_loss: double
    hours_per_week: double
    salary: categorical (2 categories)

Statistics for applicable variables:

                      NumMissing     Min      Median       Max            Mean              Std

    age                     0         17        37           90           38.5816           13.6404
    workClass            1836
    education_num           0          1        10           16           10.0807            2.5727
    marital_status          0
    race                    0
    sex                     0
    capital_gain            0          0         0        99999        1.0776e+03        7.3853e+03
    capital_loss            0          0         0         4356           87.3038          402.9602
    hours_per_week          0          1        40           99           40.4375           12.3474
    salary                  0
Because there are few categories represented in the categorical variables compared to levels in the continuous variables, the standard CART, predictor-splitting algorithm prefers splitting a continuous predictor over the categorical variables.
Train a classification tree using the entire data set. To grow unbiased trees, specify usage of the curvature test for splitting predictors. Because there are missing observations in the data, specify usage of surrogate splits.
Mdl = fitctree(X,'salary','PredictorSelection','curvature',...
    'Surrogate','on');
Estimate predictor importance values by summing changes in the risk due to splits on every predictor and dividing the sum by the number of branch nodes. Compare the estimates using a bar graph.
imp = predictorImportance(Mdl);

figure;
bar(imp);
title('Predictor Importance Estimates');
ylabel('Estimates');
xlabel('Predictors');
h = gca;
h.XTickLabel = Mdl.PredictorNames;
h.XTickLabelRotation = 45;
h.TickLabelInterpreter = 'none';
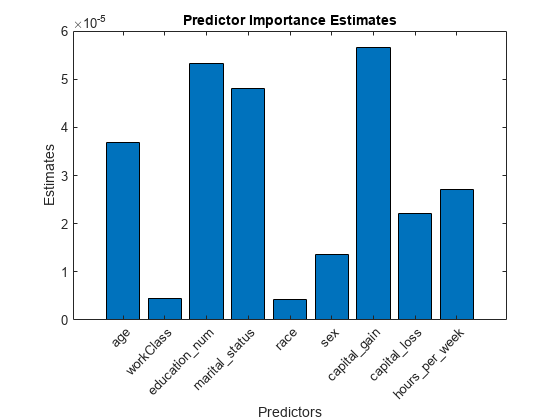
In this case, capital_gain is the most important predictor, followed by education_num.
Input Arguments
More About
Extended Capabilities
Version History
Introduced in R2011a