gagerr
R2026bGage repeatability and reproducibility study
Syntax
Description
gagerr(___, specifies
options using one or more name-value arguments in addition to any of the input argument
combinations in the previous syntaxes. For example, you can specify whether to display a bar
graph of results, and set the specification limits for the precision-to-tolerance ratio
(PTR) calculation.Name=Value)
results = gagerr(___)results. If you specify tbl or
OutputFormat="table", then results is
a table. Otherwise, results is a matrix.
Examples
Simulate a measurement data set by randomly generating 100 measurements y of three parts. Each measurement is collected by one of four randomly assigned operators.
rng(1234,"twister"); % For reproducibility
n = 100;
y = randn(n,1);
part = randi([1,3],1,n);
operator = randi([1,4],1,n);
Perform a gage repeatability and reproducibility (R&R) study on this data set using a mixed ANOVA model without interactions.
gagerr(y,{part,operator},RandomOperator=false) Source Variance PercentVariance Sigma StudyVariation PercentStudyVariation
_________________ _________ _______________ _______ ______________ _____________________
Gage R&R 0.95348 99.251 0.97646 5.0288 99.625
Repeatability 0.95348 99.251 0.97646 5.0288 99.625
Reproducibility 0 0 0 0 0
Part 0.0071911 0.74854 0.0848 0.43672 8.6518
Total 0.96067 100 0.98014 5.0477
Study Variation: 5.15*Sigma
Number of distinct categories (NDC):0
% of Gage R&R of total variations (PRR): 99.63
Note: The last column of the above table does not have to sum to 100%
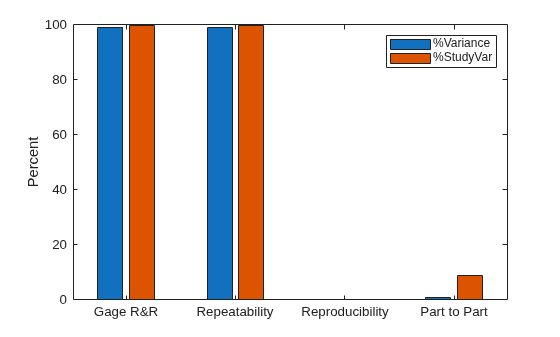
The software displays information and a bar graph summarizing the study results. Each row of the table contains statistics for a different source of variability in the measurement data. In this data set, the dominant source of variability is repeatability (the variation in the measurement value on the same part, obtained by the same operator). This source is responsible for 99.25% of the total measurement variance, and 99.63% of the total measurement standard deviation. The number of distinct categories is 0, indicating that the measurement system is not capable of distinguishing any groups within the measurement data.
Simulate a measurement data set by randomly generating 100 measurements y of five parts by three operators named A, B, and C. Each part is measured by one operator only.
rng(1234,"twister"); % For reproducibility
n = 100;
y = randn(n,1);
parts = randi(5,1,n)';
operatorName = ["A","B","C","A","A"];
operators = operatorName(parts)';
tbl = table(y,parts,operators, ...
    VariableNames=["y","Part","Operator"]);
Display the top rows of the data set.
head(tbl)
       y        Part    Operator
    ________    ____    ________

    -0.94725     1        "A"
     0.54015     3        "C"
     -0.2166     1        "A"
       1.189     5        "A"
       1.317     2        "B"
    -0.40563     1        "A"
    -0.44491     3        "C"
      1.3284     5        "A"
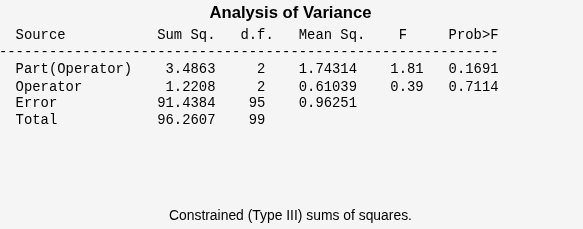
Perform a Gage repeatability and reproducibility (R&R) study on this data set using a mixed ANOVA model where Part is nested in Operator. Display the ANOVA table in a figure, and set SigmaMultiplier=6 to perform a six-sigma study.
gagerr(tbl,"y","Part","Operator",Model="part-nested", ...
    DisplayANOVA="on",SigmaMultiplier=6)
         Source          Variance    PercentVariance     Sigma     StudyVariation    PercentStudyVariation
    _________________    ________    _______________    _______    ______________    _____________________

    Gage R&R              0.96251        96.475         0.98108        5.8865               98.221
      Repeatability       0.96251        96.475         0.98108        5.8865               98.221
      Reproducibility           0             0               0             0                    0
    Part                 0.035173        3.5255         0.18754        1.1253               18.776
    Total                 0.99768           100         0.99884         5.993

Study Variation: 6.00*Sigma
Number of distinct categories (NDC):0
% of Gage R&R of total variations (PRR): 98.22
Note: The last column of the above table does not have to sum to 100%
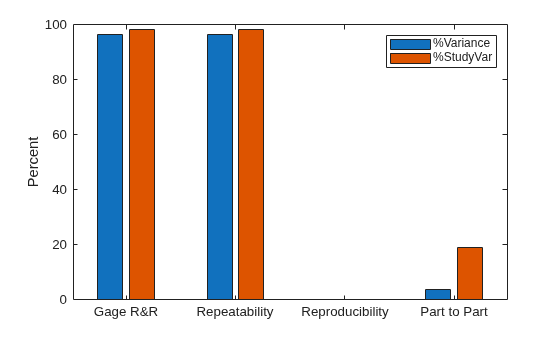
The software displays information and a bar graph summarizing the study results. Each row of the table contains statistics for a different source of variability in the measurement data. In this data set, the dominant source of variability is repeatability (the variation in the measurement value on the same part, obtained by the same operator). This source is responsible for 96.475% of the total measurement variance, and 98.1% of the total measurement standard deviation. The number of distinct categories is 0, indicating that the measurement system is not capable of distinguishing any groups within the measurement data.
Input Arguments
Name-Value Arguments
Output Arguments
More About
Alternative Functionality
Instead of using gagerr, you can perform gage R&R analysis
interactively using the Gage R&R Analyzer
app. The app offers several ways to visualize your measurement data and R&R results,
including gage bar charts, box charts, control charts, and variability charts.
References
[1] Burdick, Richard K., Connie M. Borror, and Douglas C. Montgomery. Design and Analysis of Gauge R&R Studies: Making Decisions with Confidence Intervals in Random and Mixed ANOVA Models. ASA-SIAM Series on Statistics and Applied Probability. Philadelphia, Pa. : Alexandria, Va: Society for Industrial Applied Mathematics ; American Statistical Association, 2005.

