Code Execution Profiling on Texas Instruments C2000
Sample times you specify in a Simulink® model determine the time schedule for running generated code on target hardware. If the target hardware has sufficient computing power, the code runs according to specified sample times in real-time. With real-time execution profiling, you can check if the generated code meets your real-time performance requirements.
Use code execution profiling results to enhance the design of your system. For example, if the code easily meets the real-time requirements, you can consider adding more functionality to your system to exploit available processing power. If the code does not meet real-time requirements, you can look for ways to reduce execution time. For example, you can identify tasks that require the most time and then investigate whether trade-off between functionality and speed is possible.
This topic introduces a workflow for real-time code execution profiling by showing you how to:
Configure the model for code execution profiling, and generate code.
Run generated code on target hardware.
Analyze performance through code execution profiling plots and reports.
Profiling with Hardware Profiler
Using the Hardware Profiler block, you can perform real-time execution profiling of algorithms for subsystems and blocks. To configure a Simulink model for profiling with Hardware Profiler perform these steps:
Insert the Hardware Profiler block.
Identify the subsystem to be triggered and configure it by adding function-call trigger.
Trigger the new function call subsystem using the Hardware Profiler.
Ensure the Sample Time parameter matches the algorithm's original trigger time.
Send the profiler data output through the Serial for data monitoring in host model or log the signal in external mode to see the data. For GPIO measurement mode use the DSO to measure the pulse width. For more information, see Utilize Hardware Profiler for Real-Time Execution Profiling.
Profiling in XCP External Mode
You can obtain real time profiling data by using the XCP External Mode infrastructure. To configure a Simulink model for real-time profiling perform these steps:
In the Simulink Editor, select Modeling > Model Configuration. In the Configuration Parameter dialog box, click External mode.
Note
Real-time profiling is supported only with
XCP on SerialandXCP on TCP/IPexternal communication modes.Profiling for
XCP on CANis now supported only with Metrics only.

Navigate to Code generation > Verification and select Measure task execution time.
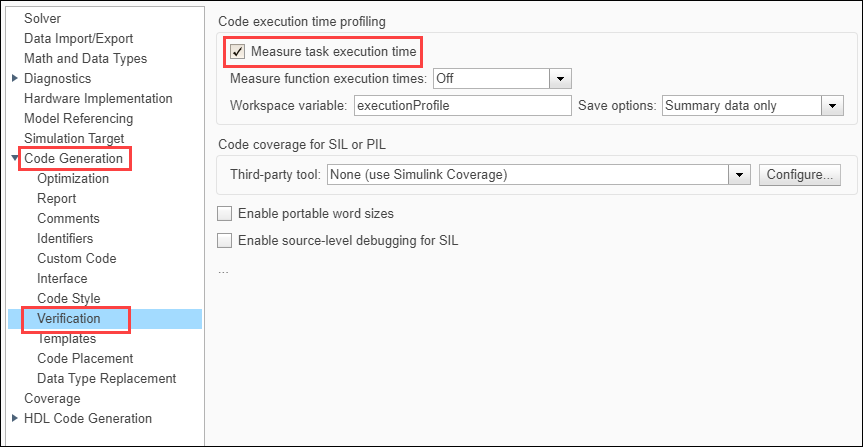
Select the required option for Measure function execution time.

Off– Select this option to disable function Profiling. Only Task profiling is available in this option.Coarse (referenced models and subsystems only)– Select this option to analyze generated function code for the main model components.Detailed (all function call sites)– Select this option to analyze generated function code for all blocks in the modelNote
Selecting
Detailed (all function call sites)option introduces a lot of overhead due to the profiling functions.
Enter the required value for Workspace variable. It is the variable in the MATLAB® workspace used for storing data received from the target.
Select the required option for Save options. For help on selecting the save options, see Save Options.

Click Monitor & Tune from the Hardware tab of Simulink toolstrip to generate the profiling report.

After the simulation ends, a profiling report is generated with profiling metrics of different tasks/functions that are being profiled. For more information, see Code Execution Profiling on Texas Instruments C2000 Targets in XCP External Mode.
Save Options
Select a save option based on the type of report you want to generate. This table explains the differences between the available save options.
| Summary data only | All data | Metrics only | |
|---|---|---|---|
| Real-time data | Available | Available | Not available. Target sends profiling data only at the end of the simulation. |
| Host memory requirement | This option requires less memory as the host stores only the summary metrics
of the profiling data. For example, 11 KB data for a model running for 50 seconds. | This option requires large memory as the host stores all the data sent by the
target. For example, 1500 KB data for a model running for 50 seconds. | This option requires less memory as the host stores only the metrics data
sent by the target. For example, 12 KB of data for a model running for 50 seconds. |
| SDI streaming | Available | Available | Not available |
| Bandwidth requirement | Requires additional bandwidth. | Requires additional bandwidth. | Does not require additional bandwidth. |
Selecting Save Options. This section helps you to select the recommended save options in different scenarios.
All data– Select this option, if the host has enough memory and the target has the required bandwidth to stream data.Summary data only– Select this option, if the simulation is running for a long time and host does not have a lot of memory.Metrics only– Select this option, if the target does not have enough time/bandwidth to stream profiling data.
Limitations
XCP stack takes up high amount of RAM and flashes on the target. This issue might occur if the target has a less amount of memory (F2802x) and a complex model is being simulated. In this case, use Profiling with JTAG Debugger Based Profiler as it has lighter memory footprint.
You need a serial connection to establish an external mode connection. If Serial connection is not available on the boards, then use FTDI chips.
Troubleshooting Profiling with XCP External Mode
Data Drop in Signal Logging or Code Execution Profiling
Description. Data drops can occur either in signal logging or profiling.
Action. Both Signal Logging and Profiling data streaming use the same communication channel to send data from the target. As channel bandwidth is limited, there could be data drops at high sample rates. This issue can be mitigated by performing these steps.
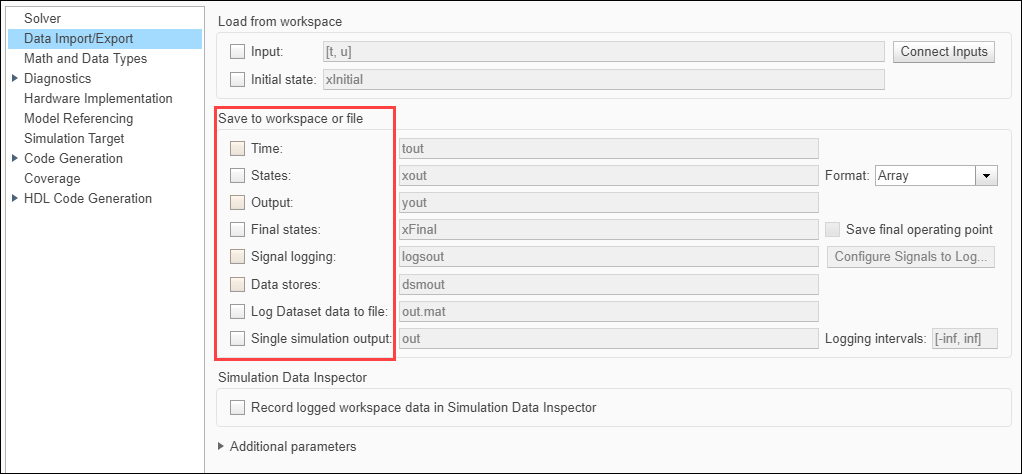
Stream only the data you need. If only profiling data is required, disable signal logging by clearing all the check boxes in Configuration Parameters > Data Import/Export > Save to workspace or file.
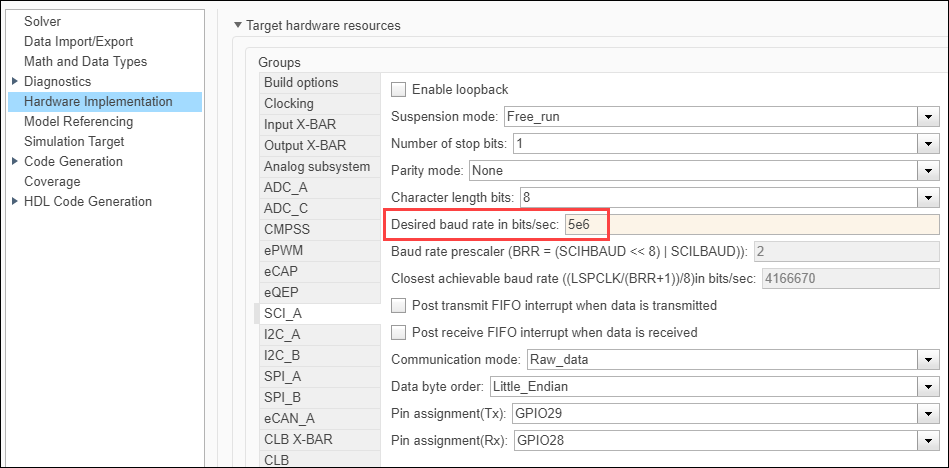
Increase the desired baud rate from SCI_x tab of Target hardware resources to get additional bandwidth to stream data at higher sample rates.
Profiling with JTAG Debugger Based Profiler
For target hardware with limited memory, use the JTAG debugger-based profiler option to perform profiling, as it does not require running a Simulink model in XCP External Mode.
Follow these steps to get JTAG profiling data from the target hardware;
In the Configuration Parameter dialog box, navigate to Code generation > Verification and select Measure task execution time.

Set the number of profiling samples to be collected on the target using this command.
codertarget.tic2000.setExecutionProfileBufferLength(<modelName>, 100)
In the above command, name of the model is the first argument and number of profiling samples is the second argument.
Click Build or Build, Deploy & Start from the Hardware tab of Simulink toolstrip.

Get profiling data from the target by executing the following command.
codertarget.profile.getData(<modelName>)
Execute the following code in MATLAB Command Window to visualize the scheduling of different tasks and functions. Notice where the faster task pre-empts the slower one and where different functions start and end.
executionProfile.schedule
For information on using C2000™ Microcontroller Blockset for real-time execution profiling of generated code, see Real-Time Code Execution Profiling.
Limitations
Real-time streaming of profiling data and SDI visualization are not supported.
Number of profiling samples to be collected on the targets must be set manually. Also, the MATLAB command must be run manually to get the data from the target.
Memory available on the target will limit the number of profiling samples that can be collected on the target.
Profiling with PIL
Perform PIL profiling by measuring the algorithm execution time in the target hardware and generate code in PIL mode. Follow these steps to profile the subsystem:
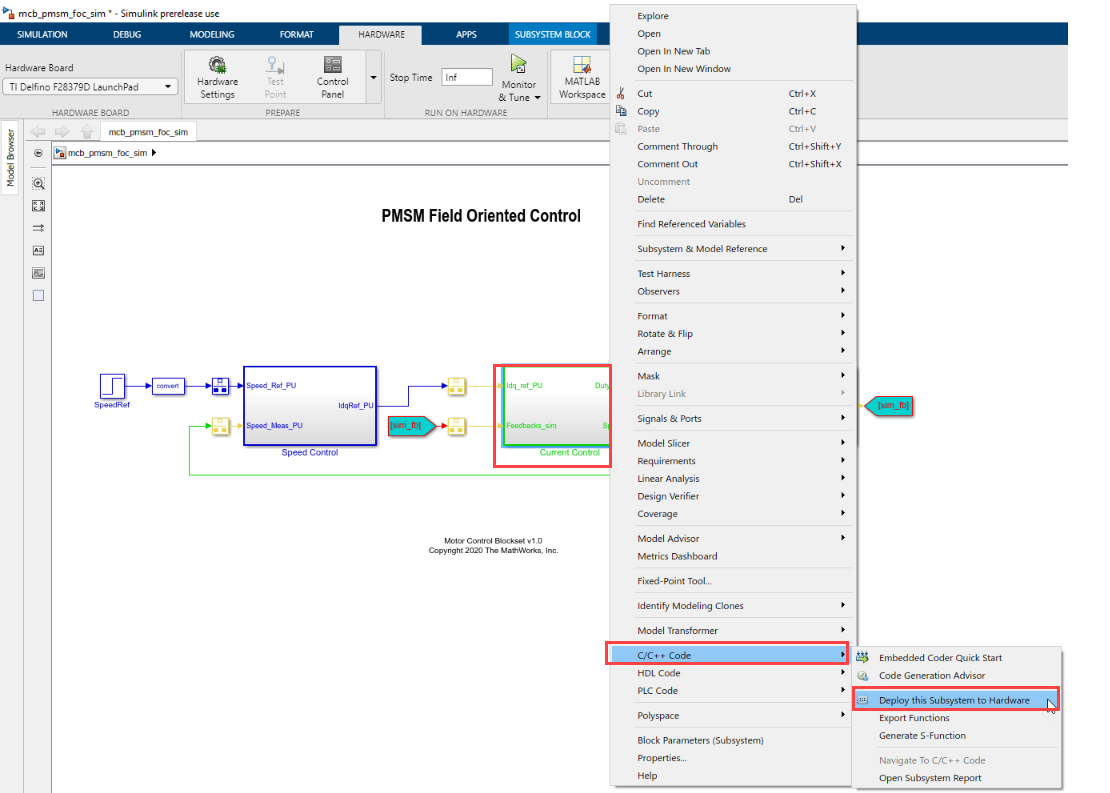
Right click on any subsystem to be profiled. Under the C/C++ Code menu, select Deploy this Subsystem to Hardware. For example, subsystem Current Control is deployed to the hardware. Follow the steps explained in Code Verification and Profiling Using PIL Testing (Motor Control Blockset) to
The system displays the Build code for Subsystem dialog box. Set the Storage Class to Inlined for all parameters.
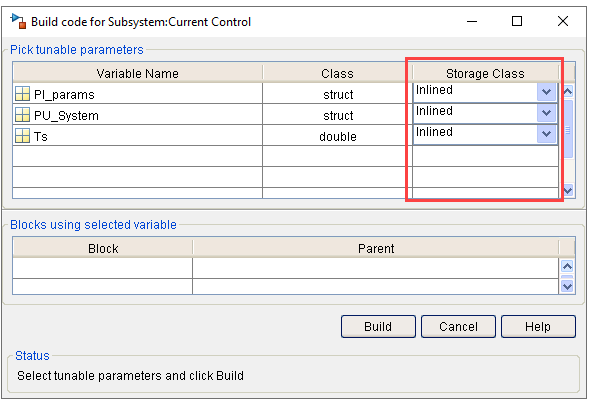
Click Build to create a model named
untitledthat includes a PIL subsystem with the same name as the subsystem to be profiled.
Rename the
subsystem(Current Control) with the subsystem (PIL) (Current Control (PIL)).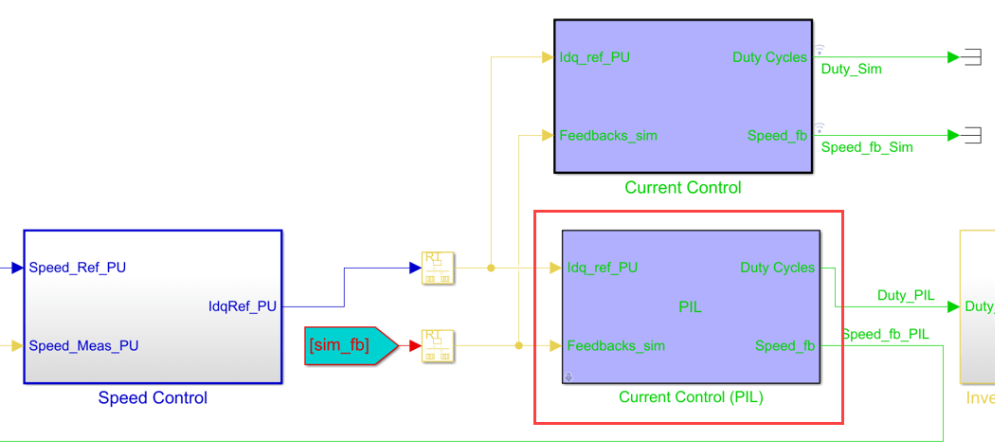
On the Simulink toolstrip, select the SIL/PIL Manager app from the Apps tab.

On the SIL/PIL toolstrip, select SIL/PIL Simulation Only.

Select Model blocks in SIL/PIL mode in the System Under Test field.

Click Run SIL/PIL on the SIL/PIL toolstrip to build the Current Control (PIL) subsystem and deploy it to the target.
For more information profiling with PIL, see Code Verification and Profiling Using PIL Testing (Motor Control Blockset), Code Verification and Validation with PIL, and Create Execution-Time Profile for Generated Code (Embedded Coder).
See Also
Hardware Profiler | Enhance Code Execution Speed in TI C2000 Simulink Applications | Summary of Profiling Techniques