Main Content

getLabelValues

Get label values from labeled signal set

Description

example

val = getLabelValues(lss) returns a table containing the label values for all members of the labeled signal set lss.

val = getLabelValues(lss,midx) returns a table containing the label values for the member specified by midx.

[val,sublbltbl] = getLabelValues(lss,midx,lblname) returns the value of the label named lblname. If lblname has sublabels, then the table sublbltbl shows the structure of the label value and its sublabel variables.

[___] = getLabelValues(___,'LabelRowIndex',ridx) specifies the row index, ridx, of an ROI or point label whose value you want to get.

[___] = getLabelValues(___,'SublabelRowIndex',sridx) specifies the row index, sridx, of an ROI or point sublabel whose value you want to get.

Examples

collapse all

Load a labeled signal set containing recordings of whale songs.

load whales
lss
lss = 
  labeledSignalSet with properties:

             Source: {2x1 cell}
         NumMembers: 2
    TimeInformation: "sampleRate"
         SampleRate: 4000
             Labels: [2x3 table]
        Description: "Characterize wave song regions"

 Use labelDefinitionsHierarchy to see a list of labels and sublabels.
 Use setLabelValue to add data to the set.

Get the values of the labels.

lbls = getLabelValues(lss)
lbls=2×3 table
                 WhaleType    MoanRegions    TrillRegions
                 _________    ___________    ____________

    Member{1}      blue       {3x2 table}    {1x3 table} 
    Member{2}      blue       {3x2 table}    {1x3 table} 

Display the moan ROI limits for the second signal of the set.

lbb = getLabelValues(lss,2,'MoanRegions')
lbb=3×2 table
     ROILimits      Value
    ____________    _____

     2.5     3.5    {[1]}
     5.8       8    {[1]}
    15.4    16.7    {[1]}

Plot the trill region of the signal between the ROI limits. Display the labeled trill peaks.

tvals = getLabelValues(lss,2,'TrillRegions');
peaks = getLabelValues(lss,2,{'TrillRegions','TrillPeaks'});

sg = getSignal(lss,2);
plot((0:length(sg)-1)/lss.SampleRate,sg)
xlim(tvals.ROILimits)
hold on
plot(peaks.Location,cell2mat(peaks.Value),'v')
hold off

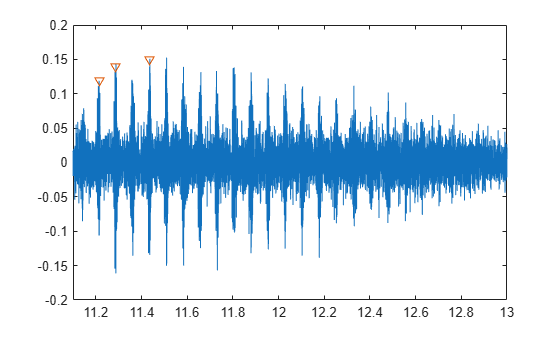
Display the coordinates of the third trill peak.

pcoor = getLabelValues(lss,2,{'TrillRegions','TrillPeaks'}, ...
    'LabelRowIndex',1,'SublabelRowIndex',3)
pcoor=1×2 table
    Location      Value   
    ________    __________

     11.437     {[0.1500]}

Input Arguments

collapse all

Labeled signal set, specified as a labeledSignalSet object.

Example: labeledSignalSet({randn(100,1) randn(10,1)},signalLabelDefinition('female')) specifies a two-member set of random signals containing the attribute 'female'.

Member row number, specified as a positive integer. midx specifies the member row number as it appears in the Labels table of a labeled signal set.

Label or sublabel name. To specify a label, use a character vector or a string scalar. To specify a sublabel, use a two-element cell array of character vectors or a two-element string array:

  • The first element is the name of the parent label.

  • The second element is the name of the sublabel.

Example: signalLabelDefinition("Asleep",'LabelType','roi') specifies a label of name "Asleep" for a region of a signal in which a patient is asleep during a clinical trial.

Example: {'Asleep' 'REM'} or ["Asleep" "REM"] specifies a region of a signal in which a patient undergoes REM sleep.

Label row index, specified as a positive integer. This argument applies only for ROI and point labels.

Sublabel row index, specified as a positive integer. This argument applies only when a label and sublabel pair has been specified in lblname and the sublabel is of type ROI or point.

Output Arguments

collapse all

Label values, returned as a table.

Sublabel values, returned as a table showing the structure of the label value and its sublabel variables.

  • If lblname has no sublabels, then sublbltbl is empty.

  • If you specify lblname as a string or cell array, then sublbltbl is empty.

Version History

Introduced in R2018b