Plotting my own validation and loss graph while training a CNN
Afficher commentaires plus anciens
Within the Deep learning Toolbox it's possible to enable the training plots within the options. It uses the following code:
Options = trainingOptions('Plots', 'training-progress');
This opens an overview of the accuracy and loss while training, like this:
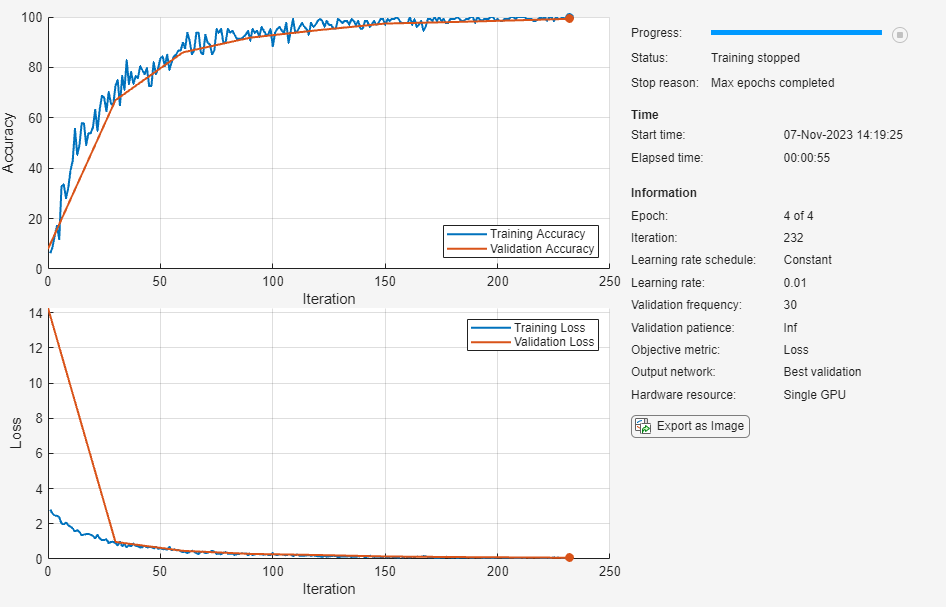
I think these two plots/graphs are amazing for the analysis of the CNN. Now, I've ran into an issue regarding enabling the option mentioned above.
This plot reporter causes conflicts when trying to use it in a standalone application using MATLAB Compiler. This conflict can be resolved by simply removing the 'Plots', 'training-progress' from the options. When removing this, you lose the two plots/graphs aswell.
I've tried to see where the measurements are stored during the plotting so I could extract the data and make my own plots/graphs. This was without sucess.
Now my question is: Is it possible to make my own accuracy and loss graphs by somehow extracting the data the program would have used to create the plots with the 'Plots' option enabled?
Any insight would help.
Greetings,
Thomas
1 commentaire
Adam
le 26 Fév 2020
I wanted to do something similar with a Self Organising Map (selforgmap), which uses a neural network (albeit a shallow simple one), but was told by Mathworks tech support that there is no option to add my own callback to be run each epoch/iteration/whenever I choose, which is what I would have needed to do. The SOM similarly can update its own specific plots while training (e.g. plotsomhits), but not custom plots.
I don't know what the solution would be for a Deep Learning example. For the SOM, I ended up writing my own SOM class so I could control everything myself, but that is a lot less feasible for deep learning networks.
Réponses (2)
Muhammad Faisal
le 21 Juil 2020
1 vote
When you call trainNetwork function, you need to return two outputs something like below
[net netinfo] = trainNetwork(......
This netinfo has Training and Validation Accuracies and Losses.
Now you can plot by using the below code
figure
plot(netinfo.TrainingLoss,'b-')
hold on
x = 1 : length(netinfo.ValidationLoss);
y = netinfo.ValidationLoss;
idx = ~any(isnan(y),1);
plot(x(idx),y(idx),'--k','Marker','.','MarkerSize' ,12);
You can add legends, xlabel, ylabel, etc. as per your requirement.
1 commentaire
Maha Mosalam
le 12 Mar 2021
this is versus no of iterations ?....if I want to plot them versus epochs ??.. thanks un advance
Catégories
En savoir plus sur Deep Learning Toolbox dans Centre d'aide et File Exchange
le 26 Fév 2020
le 17 Juin 2025
Community Treasure Hunt
Find the treasures in MATLAB Central and discover how the community can help you!
Start Hunting!
Translated by ![]()