Plotting Two Data Sets on a Figure
Afficher commentaires plus anciens
I have two sets of data which can be plotted as a sets of discrete points given by (x,y) coordinates on a 2D plot. Is there some way that I can manually plot both sets of points, join the points to have two separate curves for the two data sets and then have a legend corresponding to the points used for the plotting? If easier, I could enter the data sets as arrays by creating the matrix and then plotting from it.
I did something similar before in this case it was something like a scatter diagram whereas here I need to join the points.
Réponse acceptée
Cris LaPierre
le 24 Mar 2020
Something like this?
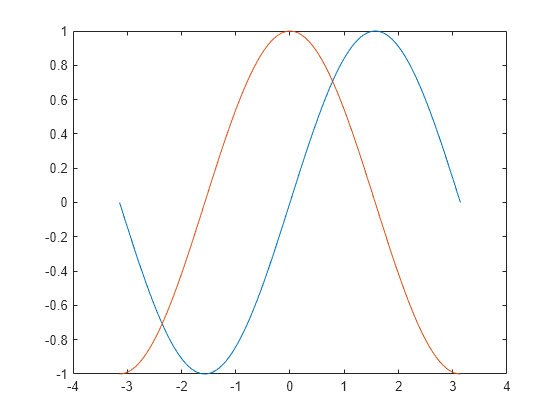
x = linspace(-pi,pi);
y1 = sin(x);
plot(x,y1)
hold on
y2 = cos(x);
plot(x,y2)
hold off
10 commentaires
Cris LaPierre
le 24 Mar 2020
If you want to manually specify the format, adjust the plot command accordingly
plot(x,y1,'r*')
x = linspace(0,pi);
y1 = cos(x);
plot(x,y1)
hold on
y2 = cos(2*x);
plot(x,y2)
legend('cos(x)','cos(2x)')

Cris LaPierre
le 24 Mar 2020
You can learn about this and more in Chapter 9 of MATLAB Onramp. It's free, interactive, and self-paced.
Hollis Williams
le 24 Mar 2020
Cris LaPierre
le 24 Mar 2020
The legend appears correctly for me. The bigger issue is you can't see the points. They are too small. I'd suggest using a different marker. I'd write your code like this
plot(89,2.71, 'b*');
hold on
plot(89,2.71, 'rs');
plot(89,2.71, 'rd');
plot(87,2.71, 'r^');
hold off
legend('Model','Data');
Hollis Williams
le 24 Mar 2020
Cris LaPierre
le 24 Mar 2020
Modifié(e) : Cris LaPierre
le 24 Mar 2020
Yup. Your code isn't quite doing what you think it is. It might be helpful to open the plot browser to see what is going on (in the figure window menu, select View>Plot Browser.
You'll see that 5 separate series have been plotted on your figure. The legend command has assigned names to the first two. You think you are naming your series by assigning each plot to a variable. However, this is capturing a handle to the plot object. You don't need it. Legend names are assigned in the order the objects were plotted. So with your example, 'Model' is assigned to the first series (plot(1,6.27, 'b.')) and 'Data' is assigned to the second (plot(2,6.23, 'b.')).
Also, turn hold on once. After you are done plotting, turn hold off.
Take a few minutes and go through Chapter 9 of Onramp. You'll save yourself a lot of wasted time by learning how plotting works in MATLAB.
Hollis Williams
le 3 Avr 2020
Cris LaPierre
le 3 Avr 2020
It sounds like you want to specify a line style rather than a marker. You can see the available line style, marker and color options here. As a simple example, you could do this.
plot(2,6.23, 'b--')
Hollis Williams
le 3 Avr 2020
Cris LaPierre
le 3 Avr 2020
Bad example. Sorry. Yes, line styles don't apply if you are plotting the points one at a time. You'll need to use a marker. Check out the link I shared. That shows you the available marker styles.
Plus de réponses (0)
Catégories
En savoir plus sur 2-D and 3-D Plots dans Centre d'aide et File Exchange
le 24 Mar 2020
le 3 Avr 2020
Community Treasure Hunt
Find the treasures in MATLAB Central and discover how the community can help you!
Start Hunting!
Translated by ![]()