How can I make the following plot?

Afficher commentaires plus anciens
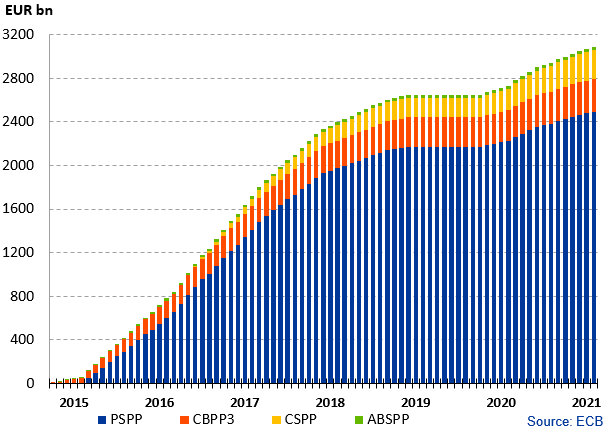
Suppose I have time series for PSPP, CBPP3, CSPP, ABSPP. How would you make a plot that looks like the one above?
Réponse acceptée

Adam Danz
le 15 Avr 2020
0 votes
Use bar(x, y, 'stacked') where x are datetime values (or integers for years) and y is a matrix where each row defines the stacked values for 1 bar. There's a example of a stacked bar chart in within the link.
Plus de réponses (1)

David Hill
le 15 Avr 2020
Assuming your inputs are a row vectors of the same size.
y=[PSPP',CBPP3',CSPP3',ABSPP'];
bar(y,'stacked');
Catégories
En savoir plus sur Bar Plots dans Centre d'aide et File Exchange
Produits
le 15 Avr 2020
le 15 Avr 2020
Community Treasure Hunt
Find the treasures in MATLAB Central and discover how the community can help you!
Start Hunting!
Translated by 

