


- /
-
Love and Peace
on 17 Nov 2023
- 6
- 33
- 0
- 0
- 331
drawframe(1);
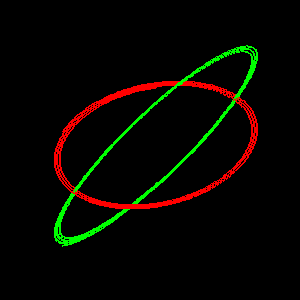
Write your drawframe function below
function drawframe(f)
cla
t = linspace(f,5,1000);
x = exp(-t./50).*sin(5*t);
y = exp(-t./50).*cos(5*t);
z1 = exp(-t./50).*sin(5*t);
z2 = exp(-t./50).*cos(5*t);
plot3(x,y,z1,'linewidth',2,'color','g');
hold on
plot3(x,y,z2,'linewidth',2,'color','r');
if f>30
text(-1,-0.5,-1,'\bf Love & Peace','color','y','fontsize',10)
end
axis tight off
g=gcf;
g.Color='k';
view(10.5-f,-18+f)
end

