


- /
-
Dice Rolls @ 10x
on 27 Nov 2023
- 32
- 91
- 0
- 3
- 596
drawframe(10);
Write your drawframe function below
function drawframe(f)
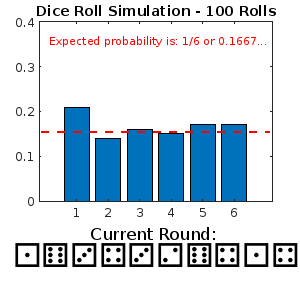
% Visualization of the law of large numbers showing how the
% experimental distribution of dice rolls approaches the expected
% distribution as number of rolls increases
close(gcf)
% Internal variables
n=10; % number of dice at each throw
f=n*f; % total number of dice thrown af each round/frame
s=6; % number of sides on dice
% Seed random generator and roll dice
rng(1);
rolls=randi([1,s],1,f); % vector of f dice rolls
counts=histcounts(rolls,1:s+1);
probs=counts/f; % probabilities/distributions of each roll value, expected to converge to 1/s (1/6)
% Top segment of figure for histogram of dice roll frequencies
subplot(4,1,1:3)
bar(probs)
annotation('line',[.136 .9],[.56 .56],Color='r',LineStyle='--',LineWidth=2)
annotation('textbox',[.14 .4 .5 .5],'String','Expected probability is: 1/6 or 0.1667...',Color='r',FitBoxToText='on',LineStyle='none',FontSize=8)
ylim([0 0.4])
title(['Dice Roll Simulation - ',num2str(f),' Rolls'])
% Bottom segment of figure for visualizing dice rolls
subplot(4,1,4)
text(0.5,0.7,'Current Round: ','FontSize',12,'HorizontalAlignment','center')
text(0.5,0.25,char(9855+rolls(end-(n-1):end)),'FontSize',24,'HorizontalAlignment','center')
axis off
end
Animation


