New in r2020b: Subtitles & Title/Label Alignment

Add a subtitle
Multi-lined titles have been supported for a long time but starting in r2020b, you can add a subtitle with its own independent properties to a plot in two easy ways.
- Use the new subtitle function: s=subtitle('mySubtitle')
- Use the new second argument to the title function: [t,s]=title('myTitle','mySubtitle')

figure()
tiledlayout(2,2)
% Method 1
ax(1) = nexttile;
th(1) = title('Pupil size');
sh(1) = subtitle('Happy faces');
ax(2) = nexttile;
th(2) = title('Pupil size');
sh(2) = subtitle('Sad faces');
% Method 2
ax(3) = nexttile;
[th(3), sh(3)] = title('Fixation duration', 'Happy faces');
ax(4) = nexttile;
[th(4), sh(4)] = title('Fixation duration', 'Sad faces');
set(ax, 'xticklabel', [], 'yticklabel', [],'xlim',[0,1],'ylim',[0,1])
% Set all title colors to orange and subtitles colors to purple.
set(th, 'Color', [0.84314, 0.53333, 0.1451])
set(sh, 'Color', [0, 0.27843, 0.56078])
Control title/Label alignment
Title and axis label positions can be changed via their Position, VerticalAlignment and HorizontalAlignment properties but this is usually clumsy and leads to other problems when trying to align the title or labels with an axis edge. For example, when the position units are set to 'data' and the axis limits change, the corresponding axis label will change position relative to the axis edges. If units are normalized and the axis position or size changes, the corresponding label will no longer maintain its relative position to the axis, and that's assuming the normalized position was computed correctly in the first place.
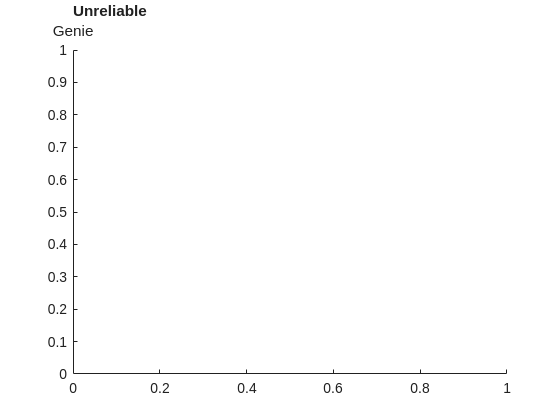
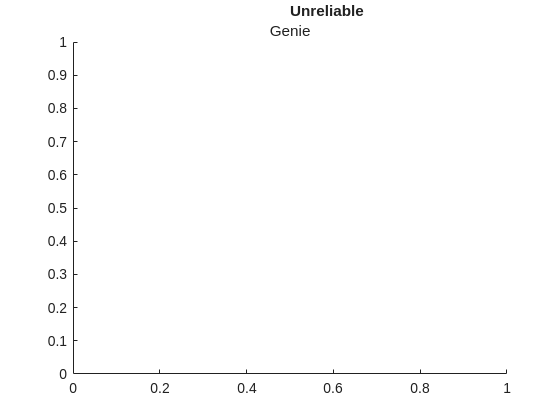
Starting in r2020b, title and axis label alignment can be set to center|left|right, relative to the axis edges.
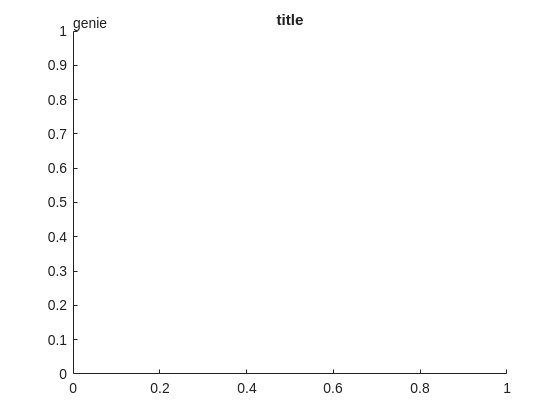
- TitleHorizontalAlignment is a property of the axis: h.TitleHorizontalAlignment='left';
- LabelHorizontalAlignment is a property of the ruler object that defines the x | y | z axis: h.XAxis.LabelHorizontalAlignment='left';

% Create data
x = randi(50,1,100)';
y = x.*[.2, -.2] + (rand(numel(x),2)-.5)*10;
gray = [.65 .65 .65];
% Plot comparison between columns of y
figure()
tiledlayout(2,2,'TileSpacing','none')
ax(1) = nexttile(1);
plot(x, y(:,1), 'o', 'color', gray)
lsline
ylabel('Y1 (units)')
title('Regression','Y1 & Y2 separately')
ax(2) = nexttile(3);
plot(x, y(:,2), 'd', 'color', gray)
lsline
xlabel('X Label (units)')
ylabel('Y2 (units)')
grid(ax, 'on')
linkaxes(ax, 'x')
%  Move title and labels leftward
set(ax, 'TitleHorizontalAlignment', 'left')
set([ax.XAxis], 'LabelHorizontalAlignment', 'left')
set([ax.YAxis], 'LabelHorizontalAlignment', 'left')
% Combine the two comparisons into plot and flip the second
% y-axis so trend are in the same direction
ax(3) = nexttile([2,1]);
yyaxis('left')
plot(x, y(:,1), 'o')
ylim([-6,16])
lsline
xlabel('X Label (units)')
ylabel('Y1 (units) \rightarrow')
yyaxis('right')
plot(x, y(:,2), 'd')
ylim([-16,6])
lsline
ylabel('\leftarrow Y2 (units)')
title('Direct comparison','(Y2 axis flipped)')
set(ax(3),  'YDir','Reverse')
% Align the ylabels with the minimum axis limit to emphasize the
% directions of each axis. Keep the title and xlabel centered
ax(3).YAxis(1).LabelHorizontalAlignment = 'left';
ax(3).YAxis(2).LabelHorizontalAlignment = 'right';
ax(3).TitleHorizontalAlignment = 'Center';       % not needed; default value.
ax(3).XAxis.LabelHorizontalAlignment = 'Center'; % not needed; default value.
5 commentaires
Date décroissante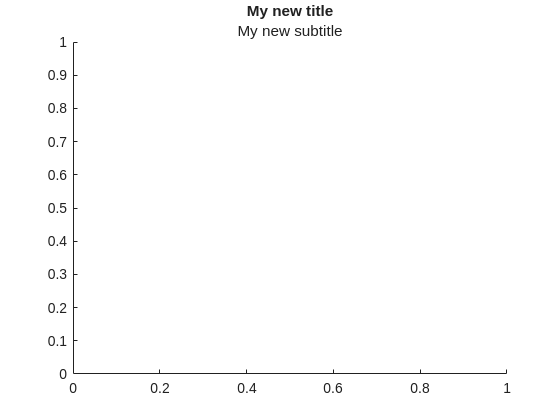
- TitleHorizontalAlignment: justifies the title relative to the left/right of the axes.
- HorizontalAlignment: positions the text to the anchor point. The achor point is the text object's coordinate.
This is a welcome addition.