Résultats pour
Hi All,
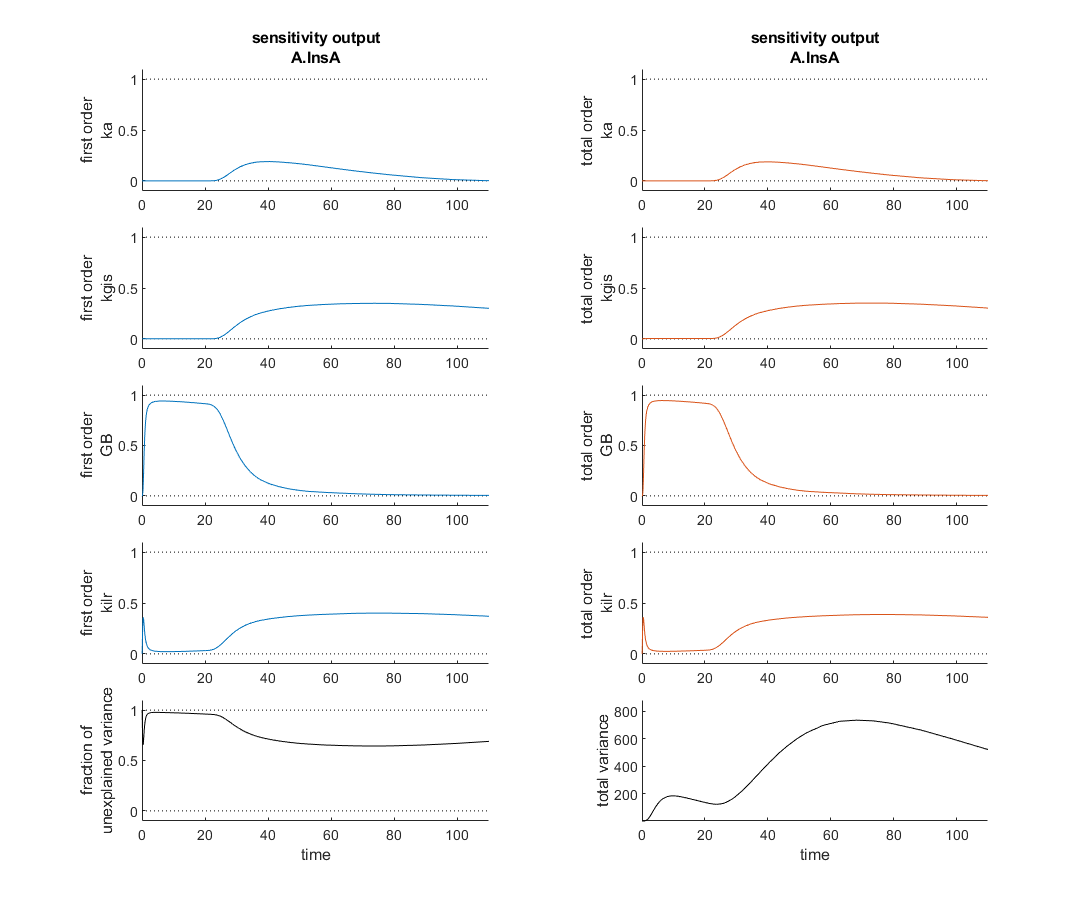
I'm currently verifying a global sensitivity analysis done in SimBiology and I'm a touch confused. This analysis was run with every parameter and compartment volume in the model. To my understanding the fraction of unexplained variance is 1 - the sum of the first order variances, therefore if the model dynamics are dominated by interparameter effects you might see a higher fraction of unexplained variance. In this analysis however, as the attached figure shows (with input at t=20 minutes), the most sensitive four parameters seem to sum, in first order sensitivities to roughly one at each time point and the total order sensitivies appear nearly identical. So how is the fraction of unexplained variance near one?
Thank you for your help!
With a deployment of ThingSpeak on August 15th, 2024, we are using a new library for visualization of ThingSpeak channel charts. This should require no changes on your part. If you notice any discrepancies/differences in your channel visualization, please post a screenshot on this thread.
Imagine that the earth is a perfect sphere with a radius of 6371000 meters and there is a rope tightly wrapped around the equator. With one line of MATLAB code determine how much the rope will be lifted above the surface if you cut it and insert a 1 meter segment of rope into it (and then expand the whole rope back into a circle again, of course).
Due to API changes at X, formerly known as Twitter, the integration between ThingSpeak and X, specifically the ThingTweet functionality, was not operational for a number of months. As of August 1st, 2024, the ThingTweet functionality is being deprecated.
The alternative, which requires manual steps due to X requiring manual application for a developer account, is to use the TWITTER function from Datafeed toolbox in MATLAB code. You can then create a React that is associated with this MATLAB code to post to X.
I use "x = ThingSpeak.writeFields(myChannelNumber1, myWriteAPIKey1);" in my code to update the ThingSpeak channel. 4 fields are associated with this channel. This statement is executed about once every 5 minutes.
Roughly 60% of the time, I got an error message "HTTP error code -301". The other 40% of time the channel update is successful. What does the "HTTP error code -301" mean? Any suggestion on how to improve the success rate of the channel update
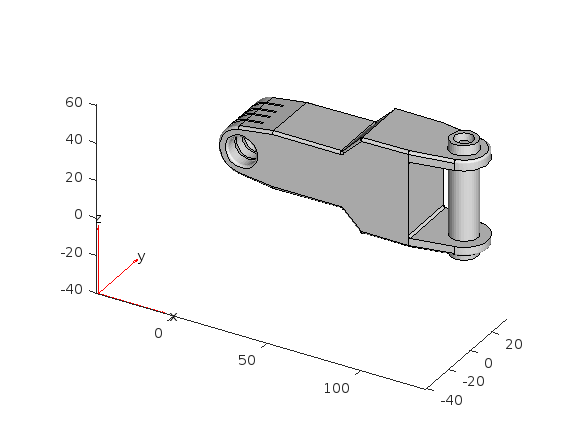
Something that had bothered me ever since I became an FEA analyst (2012) was the apparent inability of the "camera" in Matlab's 3D plot to function like the "cameras" in CAD/CAE packages.
For instance, load the ForearmLink.stl model that ships with the PDE Toolbox in Matlab and ParaView and try rotating the model.
clear
close all
gm = importGeometry( "ForearmLink.stl" );
pdegplot(gm)
Things to observe:
- Note that I cant seem to rotate continuously around the x-axis. It appears to only support rotations from [0, 360] as opposed to [-inf, inf]. So, for example, if I'm looking in the Y+ direction and rotate around X so that I'm looking at the Z- direction, and then want to look in the Y- direction, I can't simply keep rotating around the X axis... instead have to rotate 180 degrees around the Z axis and then around the X axis. I'm not aware of any data visualization applications (e.g., ParaView, VisIt, EnSight) or CAD/CAE tools with such an interaction.
- Note that at the 50 second mark, I set a view in ParaView: looking in the [X-, Y-, Z-] direction with Y+ up. Try as I might in Matlab, I'm unable to achieve that same view perspective.
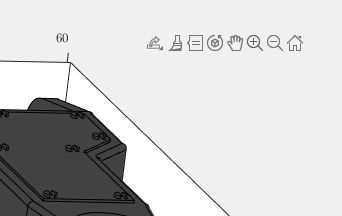
Today I discovered that if one turns on the Camera Toolbar from the View menubar, then clicks the Orbit Camera icon, then the No Principal Axis icon:
That then it acts in the manner I've long desired. Oh, and also, for the interested, it is programmatically available: https://www.mathworks.com/help/matlab/ref/cameratoolbar.html
I might humbly propose this mode either be made more discoverable, similar to the little interaction widgets that pop up in figures:
Or maybe use the middle-mouse button to temporarily use this mode (a mouse setting in, e.g., Abaqus/CAE).
I've noticed is that the highly rated fonts for coding (e.g. Fira Code, Inconsolata, etc.) seem to overlook one issue that is key for coding in Matlab. While these fonts make 0 and O, as well as the 1 and l easily distinguishable, the brackets are not. Quite often the curly bracket looks similar to the curved bracket, which can lead to mistakes when coding or reviewing code.
So I was thinking: Could Mathworks put together a team to review good programming fonts, and come up with their own custom font designed specifically and optimized for Matlab syntax?
Problem statement: I've written a visualization that I'd like to use on potentially hundreds of different channels in my commerical account. Because it contains code that's unique to the channel (channel id, read API key, etc.) I have to create and maintain a duplicate visualization for each channel. This is wasteful, a source of errors, and almost intractable for a commercial customer with a high channel count.
My request is that MATLAB Visualizations be extended to support parameters, but only a predefined set to reduce the scope. I would propose a subset of the parameters currently supported by the ThingSpeak API. For example, thingSpeakRead supports (requires) readChannelID, NumPoints, and a ReadKey etc. If those were elevated to also be allowed as Visualization parameters, I imagine it would satisfy a large subset of user needs.
The poor man's version of this would be if ThingSpeak supported just one special parameter, such as %CHANNEL_ID%. If this was available within the visualization code one could use it as a key into table to get the other pieces of data like API keys, etc. It would be have to be passed on the visualization url (https://thingspeak.com/apps/matlab_visualizations/573779?readChannelID=xxxxx). Not sure how the visualization would pick it up in the use case where it's called from the ThingSpeak website under the user's list of MATLAB Visualizations. Perhaps it can be prompted for.
I initially considered user defined functions or libraries but they are not supported and I can see that that would require even more development work to support. The workarounds described in this thread aren't suitable for me. https://www.mathworks.com/matlabcentral/answers/2102981-how-to-use-private-functions-lib-in-thingspeak?s_tid=srchtitle_community_thingspeak_14_libraries
thanks!
Tom
how can I link a chinese flow meter to this website
Die Anzeige der Werte in den einzelnen Feldern ist nicht aktuell.
So werden z.B. um 18:00 Uhr nur die Werte bis 14:00 Uhr angezeigt, auch das verändern des Zeitfensters bringt keine Abhilfe.
Hat jemand eine Idee wie ich die der Uhrzeit ensprechenden Werte zur Anzeige bringe.
Die Werte werden von Shellies und BitShake kontinuierlich übertragen.
My thingSpeak channel kept on updateing the same signal as early eventhough my simulink have update the new signal. How to solve this?
Hi ThingSpeak Community,
I hope you are all doing well.
I am currently setting up a Vodafone ACL for a SIM card that will be used in a device destined for a remote charity deployment in a week. The goal is to ensure that the device can reliably upload data to ThingSpeak without any connectivity issues.
Here are the details of my current ACL setup:
- FQDN: api.thingspeak.com (specified as the API endpoint)
- IPv4 Address: 184.106.153.149 (found online)
- Port: (left empty)
I've attached a photo of the setup for reference.
Could you please confirm if the above ACL settings are correct? Additionally, if there are any other considerations or settings I should be aware of for ensuring reliable connectivity with ThingSpeak, I would greatly appreciate your guidance.
Currently, all I am using for the device credentials is the PIN number. Do I need to adjust any settings in the Arduino code or the ACL to maintain stable connectivity with ThingSpeak, especially considering the device will be in a remote location and difficult to access for adjustments?
Your prompt assistance and advice will be immensely valuable, as I want to ensure everything is correctly configured before deployment.
Thank you very much!
Best regards,
Arthur
An option for 10th degree polynomials but no weighted linear least squares. Seriously? Jesse
Hi to everyone!
To simplify the explanation and the problem, I simulated the kinetics of an irreversible first-order reaction, A -> B. I implemented it in two independent compartments, R and P. I simulated the effect of a dilution in R by doubling at t= 0,1 the R volume. I programmed in P that, at t = 0.1, the instantaneous concentration of A and B would be reduced by half. I am sending an attach with the implementation of these simulations in the Simbiology interface.
When the simulations of the two compartments are plotted, it can be seen that the responses are not equal. That is, from t = 0.1 s, the reaction follow an exponential function in R with half of the initial amplitude and half of the initial value of k1. That is, the relaxation time is doubled. Meanwhile, in P, from t = 0.1, the reaction follows exponential kinetics with half the amplitude value but maintaining the initial value of k = 10. Without a doubt, the correct simulation is the latter (compartment P) where only the effect is observed in the amplitude and not in the relaxation time. Could you tell me what the error is that makes these kinetics that should be equal not be?
Thank you in advance!
Luis B.
Hi All,
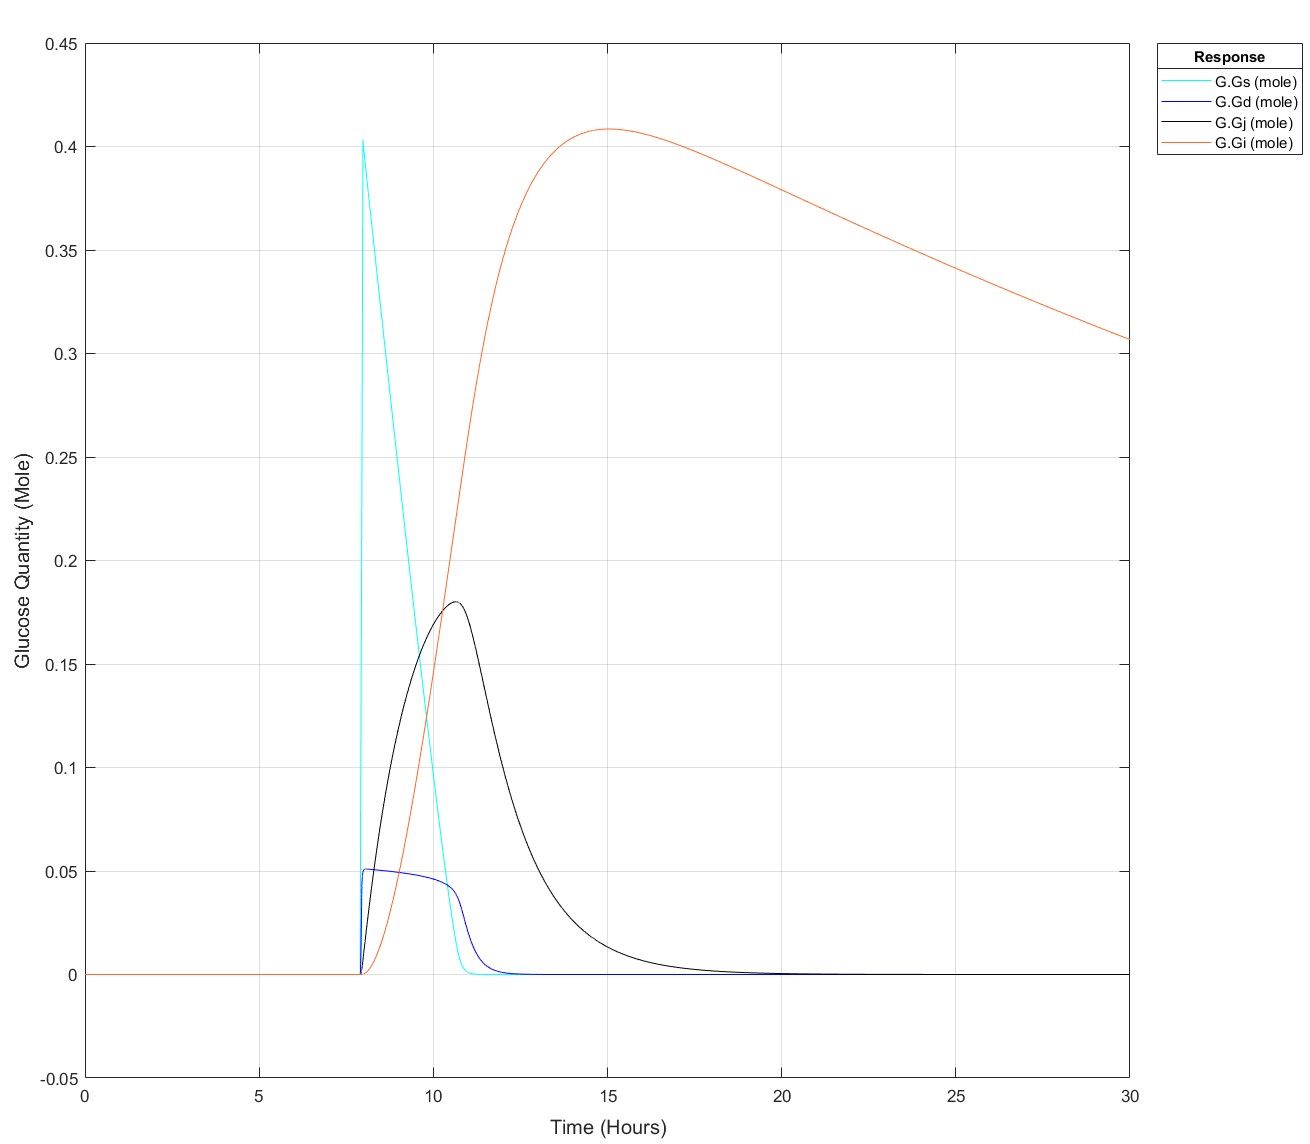
I've been producing a QSP model of glucose homeostasis for a while now for my PhD project, recently I've been able to expand it to larger time series, i.e. 2 days of data rather than a singular injection or a singular meal. My problem is as follows: If I put 75g of glucose into my stomach glucose species any later than (exactly) 8.5 hours I get an integration tolerance error. Curiosly, I can put 25g of glucose in at any time up to 15.9 hours, then any later an error. I have disabled all connections to my glucose absorption chain, i.e. stomach -> duodenum -> jenenum -> ileum -> removal, to isolate the cause of this. I had initially thought it may be because I mechanistically model liver glycogen and that does deplete over time, but I've tested enough to show that that does nothing. My next test is to isolate the glucose absorption chain into a seperate model and see if the issue persists but I'm completely baffled!
These are the equations, to my eye there's no reason why there would be such a sharp glucose quantity/time dependence, they all begin at a value of 0:
d(Gs)/dt = -(kw*(1-Gd^14/(Igd^14+Gd^14))*Gs) #Stomach glucose
d(Gd)/dt = (kw*(1-Gd^14/(Igd^14+Gd^14))*Gs) - (kdj*Gd) #Duodenal Glucose
d(Gj)/dt = (kdj*Gd) - (kji*Gj) #Jejunal Glucose
d(Gi)/dt = (kji*Gj) - (kic*Gi) #Ileal Glucose
(The sigmoidicity of gastric emptying slowing term (^14) was parameterised off of paracetamol absorption data and appears to be correct!)
Thank you for your help, best regards,
Dan
Pre-Edit: I changed the run time to 30 hours and now I can't use the 75g input any later than 7.9 hours not 8.5 hours anymore!
Edit: This is how it appears at all times prior to it failing for 75g:
I have lon and lat and signal stengths plotting from my roaming GPS Lora module that reports signal strength to Thingspeak at it's location. I got GEOSCATTER plotting location circles.But i want extrapulate?Interp?Heatmap. the stengths between the points. When i use Interp i end up timiming out. How do i modify my code to do this?
Public Channel 214526
Cheers Andy
Spring is here in Natick and the tulips are blooming! While tulips appear only briefly here in Massachusetts, they provide a lot of bright and diverse colors and shapes. To celebrate this cheerful flower, here's some code to create your own tulip!

Hallo zusammen,
seit ein paar Tagen werden sämtliche meiner Visualisierungen nicht mehr aktualisiert. Im Editiermodus läuft der Code durch und die Grafik wird korrekt erzeugt.
Hat jemand eine Idee was da schief läuft?
Danke & viele Grüße
Drumlin Farm has welcomed MATLAMB, named in honor of MathWorks, among ten adorable new lambs this season!

Hi Helpdesk,
I urgently seek assistance with an issue that has persisted for a week. I am using Node-RED to interface my gateway and vibration sensor. The sensor sends 960 packets of X, Y, and Z data every 5 minutes. I retrieve and send this data through my Thingspeak42 node to my Thingspeak channel.
I am subscribed to the Thingspeak Student paid plan (see attached "12.png"). Despite this, Thingspeak is inconsistently snipping my data. For example, my X-field sometimes receives only 78 out of 960 points, and similar inconsistencies occur with the Y and Z fields.
Attached is "vibration data node red.png," showing an attempt to send just 120 packets to my Thingspeak channel. However, only 93 data points are received. Also attached is a JSON snapshot of field 2 - X_values, showing only 93 points ("JSON Field 2 data.png"). This is disappointing given that I am paying for the student plan, which should support 33 million points/year per unit (~90,000/day per unit).
I urgently require an explanation and resolution for this issue. Please provide immediate assistance.
Kind regards,
Krish