Résultats pour
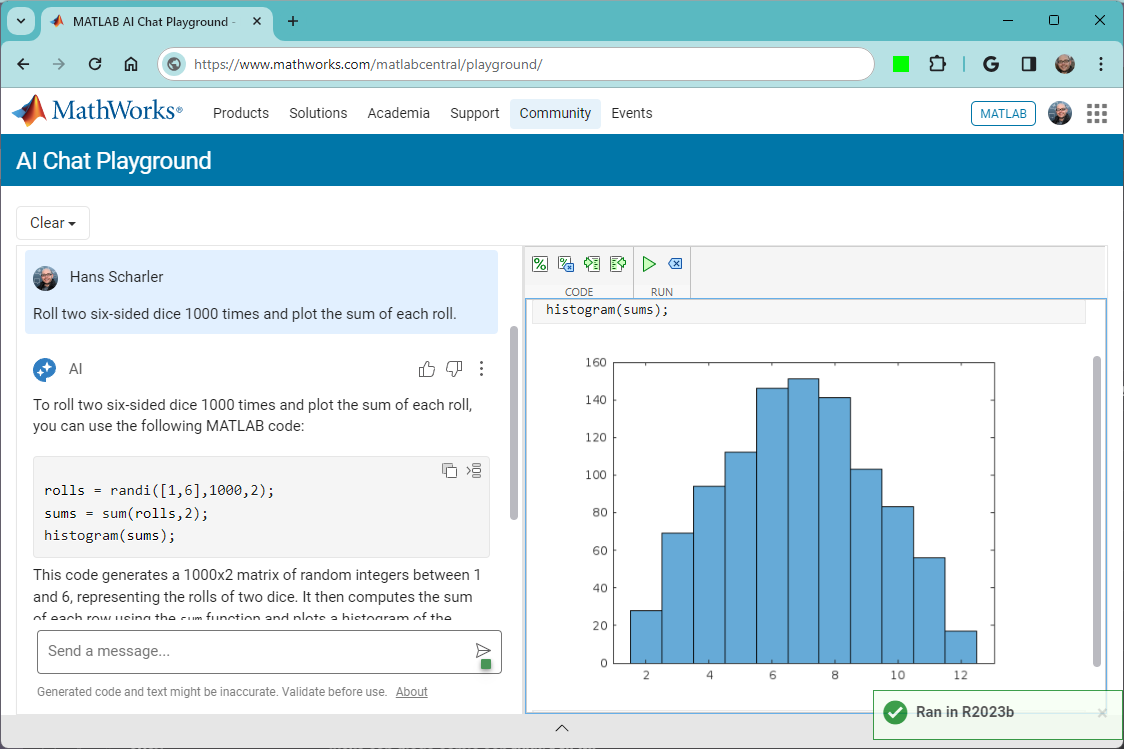
The MATLAB AI Chat Playground is open to everyone!
Check it out here on the community: https://www.mathworks.com/matlabcentral/playground
Hi All,
I'm currently attempting to implement a Hodgkin-Huxley-type model of membrane potential, ideally I would like a species that represents the membrane potential as its own distinct entity, so as the reference elsewhere. I've currently established a molarity-based work around but it would be great if I could set the units for the species as millivolt, but that throws an error.
Is there an established way to do this? I imagine I'm not the first person to be trying to model a voltage-gated ion channel!
Thank you for your help.

Share your fun photos in the comments!
Hello,
I've looked around and I haven't found anything obvious about this, but is it possible to link to species/reactions, graphically, in a non-mass transfer sense? I have areas in my model where it would conceptually make sense to be able to see that species or reactions are linked, but if I link them in the standard way it demands that it be involved in the stoichiometry.
Perhaps some kind of dotted line, or similar?
Thank you, best regards,
Dan
I know the latest version of MATLAB R2023b has this feature already, put it should be added to R2023a as well because of its simplicity and convenience.
Basically, I want to make a bar graph that lets me name each column in a basic bar graph:
y=[100 99 100 200 200 300 500 800 1000];
x=["0-4" "5-17" "18-29" "30-39" "40-49" "50-64" "65-74" "75-84" "85+"];
bar(x,y)
However, in R2023a, this isn't a feature. I think it should be added because it helps to present data and ideas more clearly and professionally, which is the purpose of a graph to begin with.
Would it be a good thing to have implicit expansion enabled for cat(), horzcat(), vertcat()? There are often situations where I would like to be able to do things like this:
x=[10;20;30;40];
y=[11;12;13;14];
z=cat(3, 0,1,2);
C=[x,y,z]
with the result,
C(:,:,1) =
10 11 0
20 12 0
30 13 0
40 14 0
C(:,:,2) =
10 11 1
20 12 1
30 13 1
40 14 1
C(:,:,3) =
10 11 2
20 12 2
30 13 2
40 14 2


Wait for Walter, the rest of us are mere users.
MATLAB Training

MATLAB Training

Mathworks tech support

Stand Back. I'm going to try MATLAB.
Embarassed by Walter Roberson

I use MATLAB.

MATLAB Reloaded

MATLAB Men

MATLAB rule!

So true.

MATLAB Road in theaters May 15, 2024.