Plotting Chord Diagrams in MATLAB
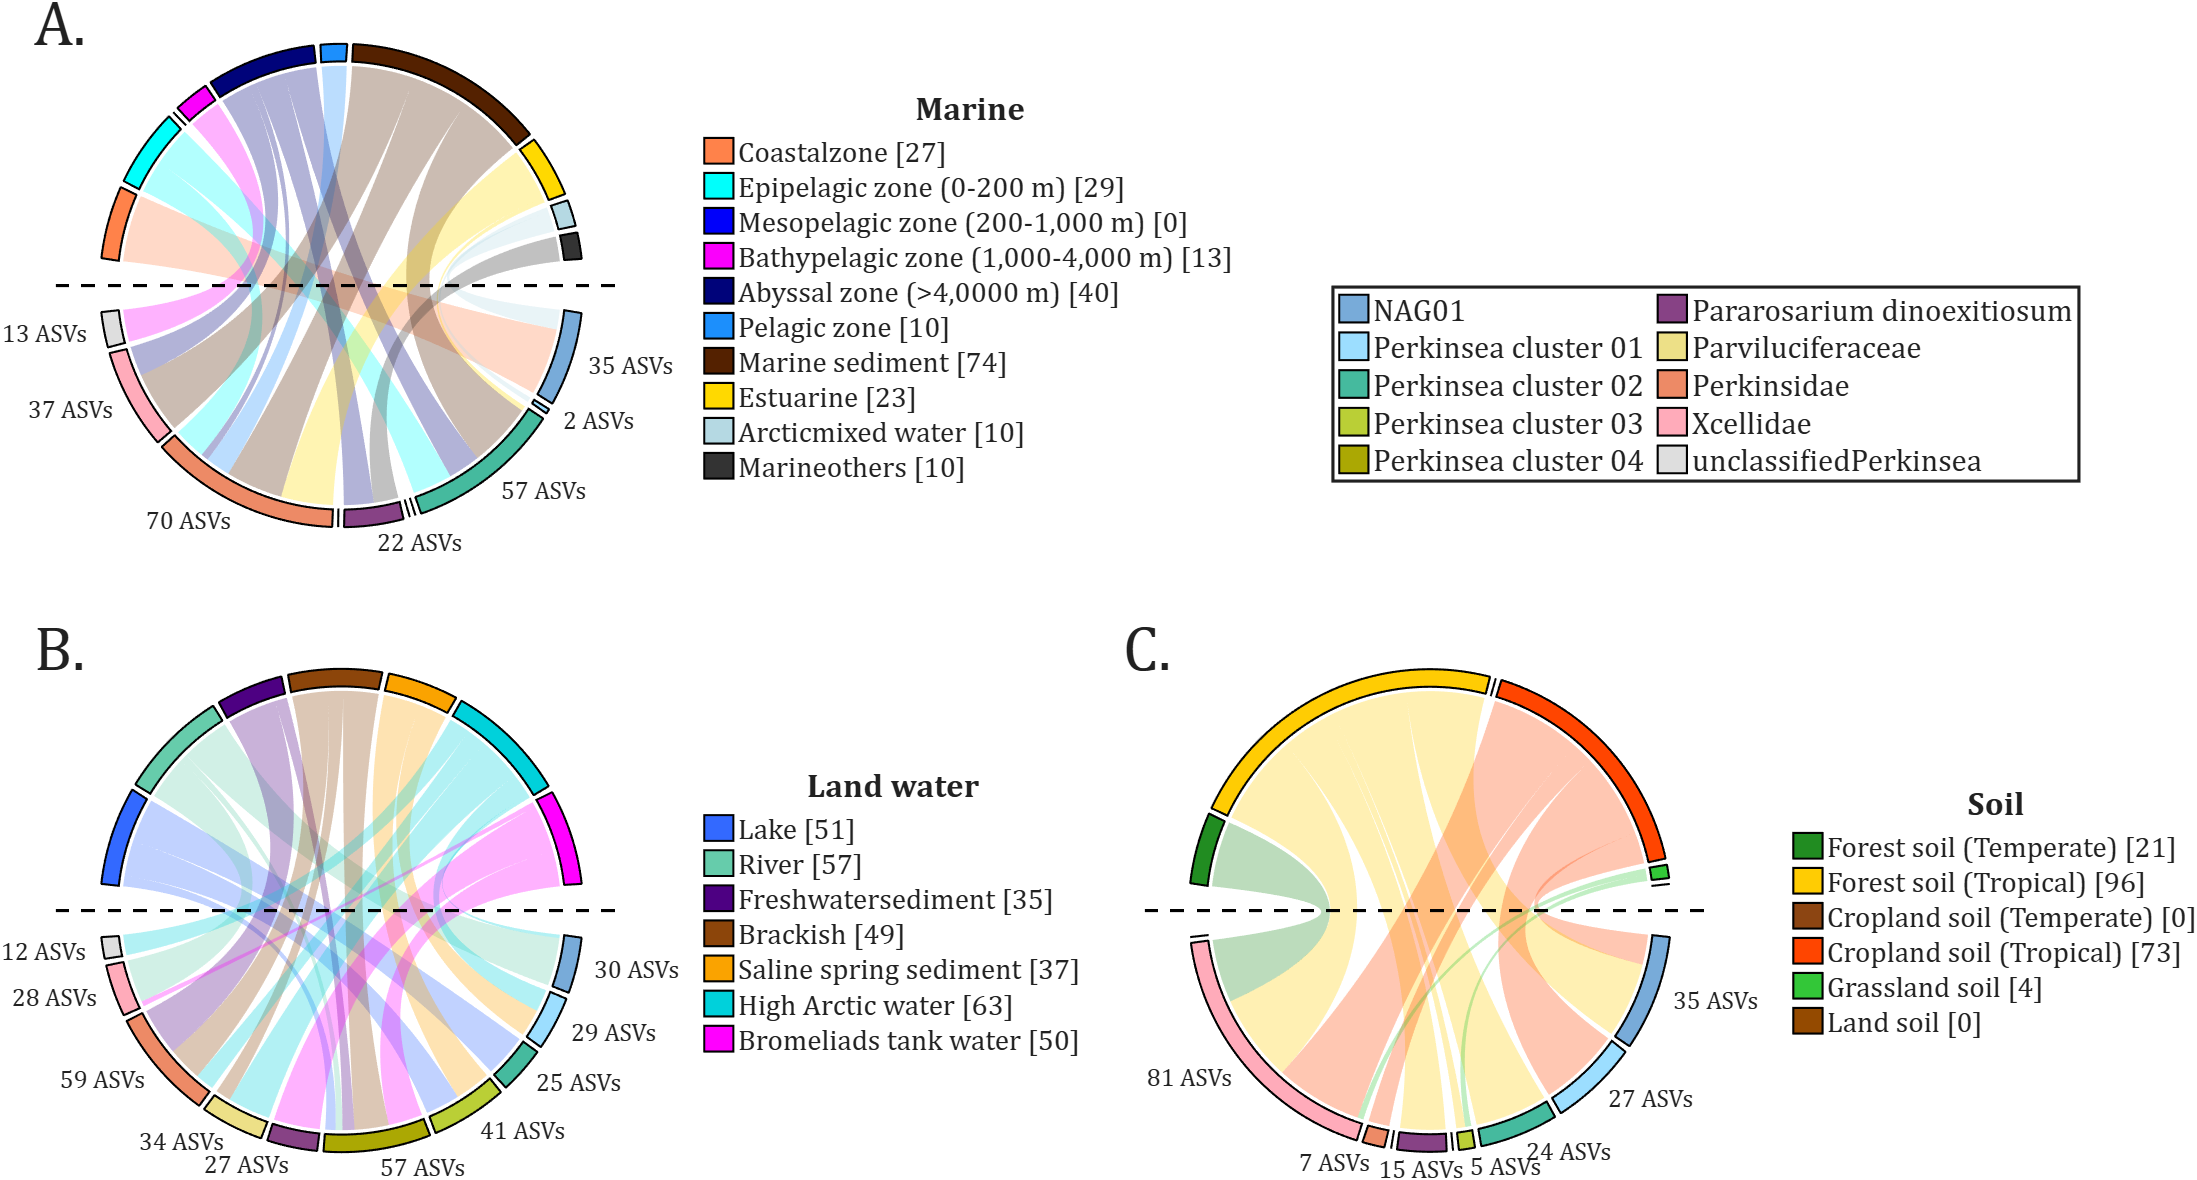
All figures presented in this Discussion were generated using MATLAB.
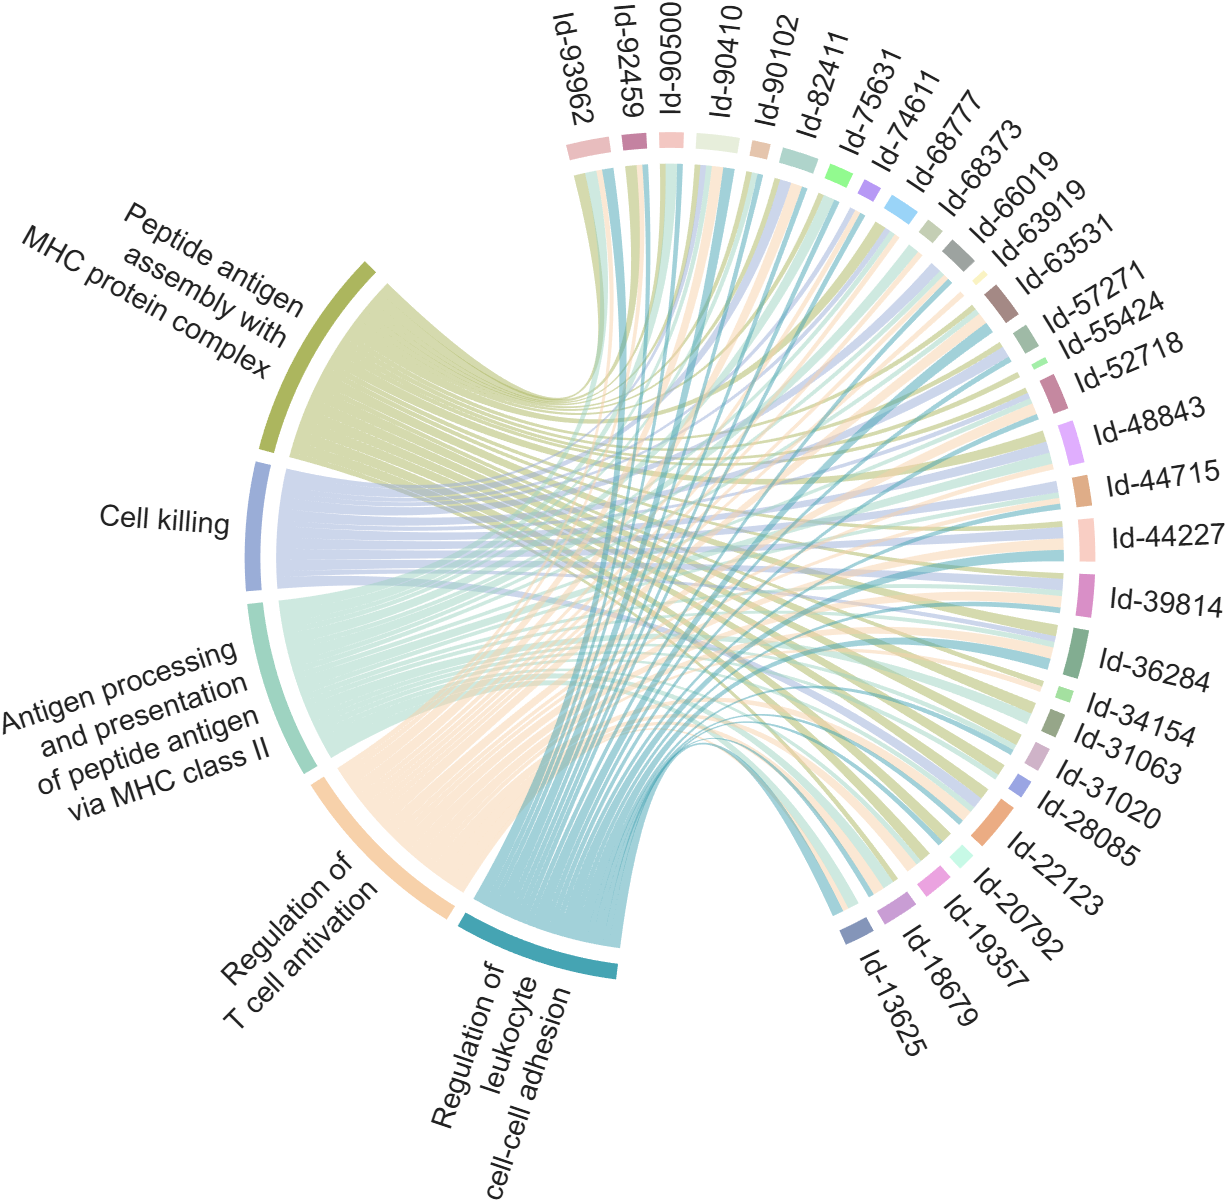
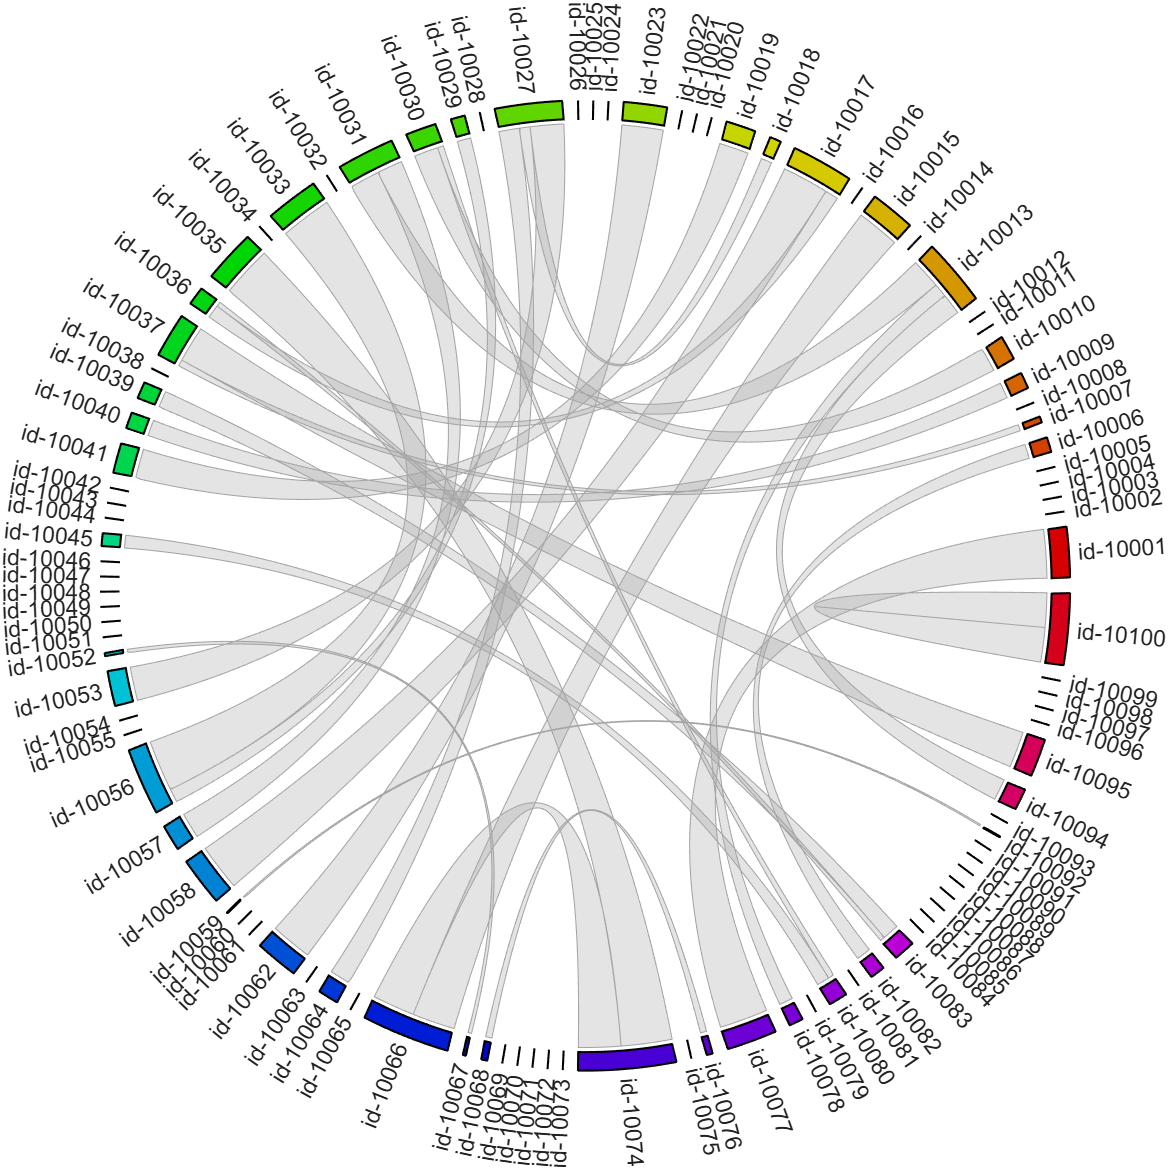
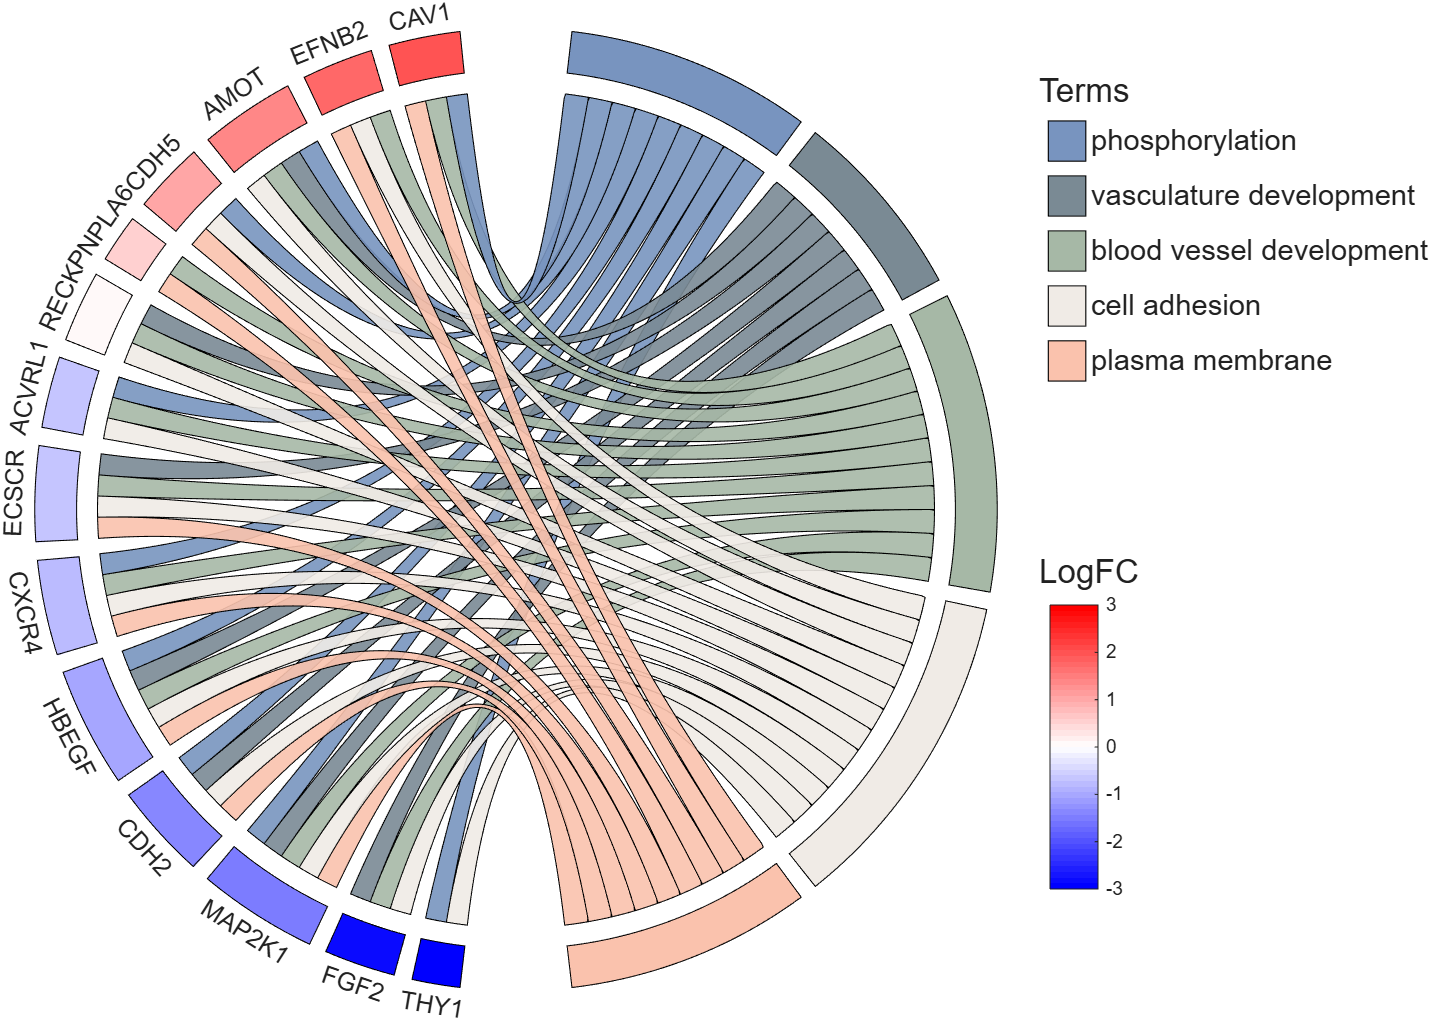
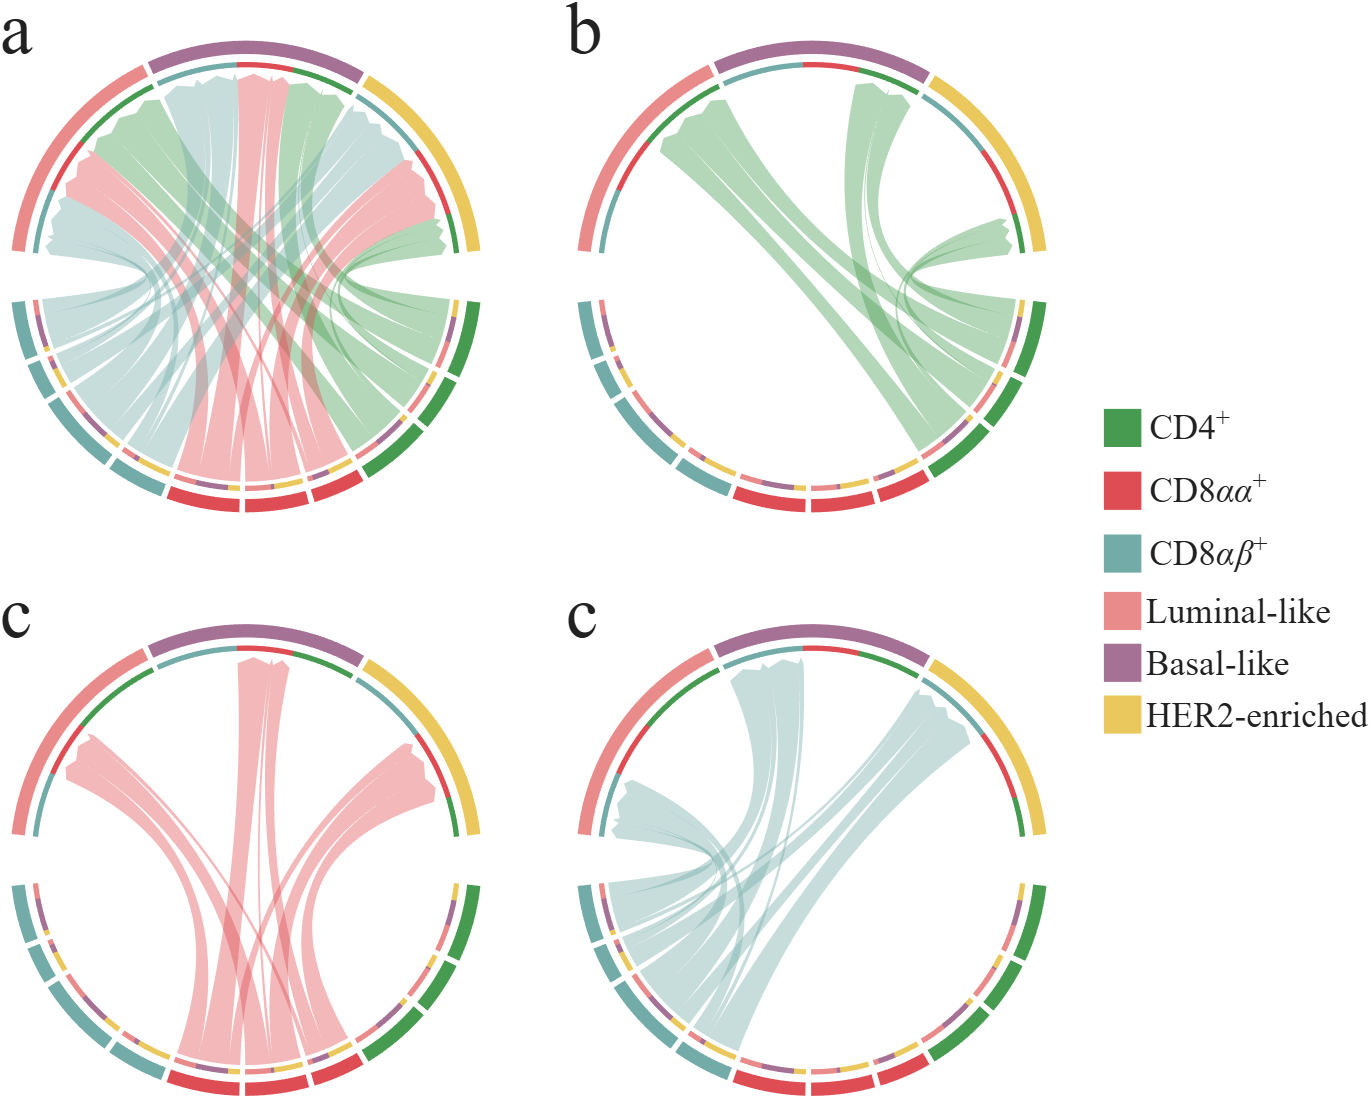
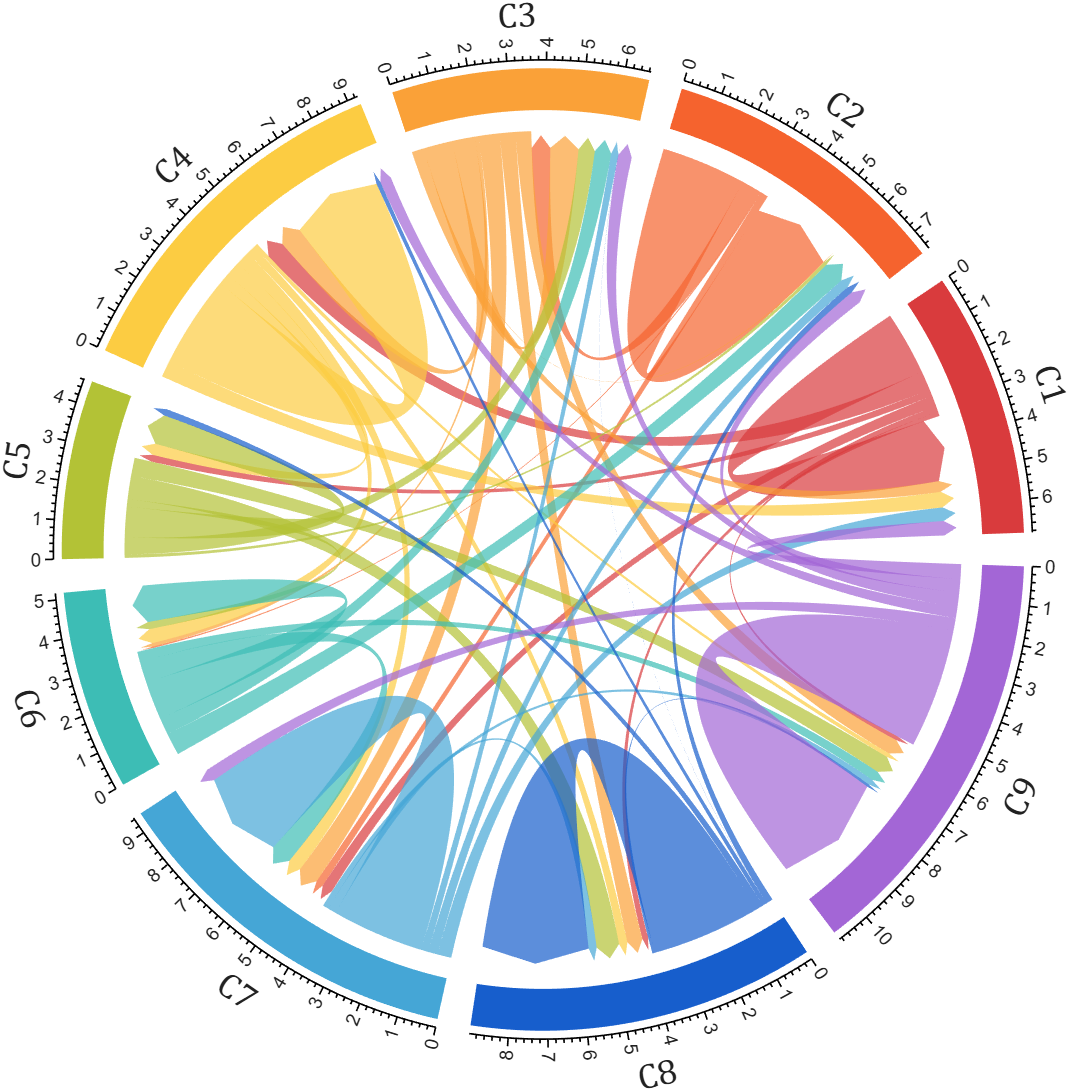
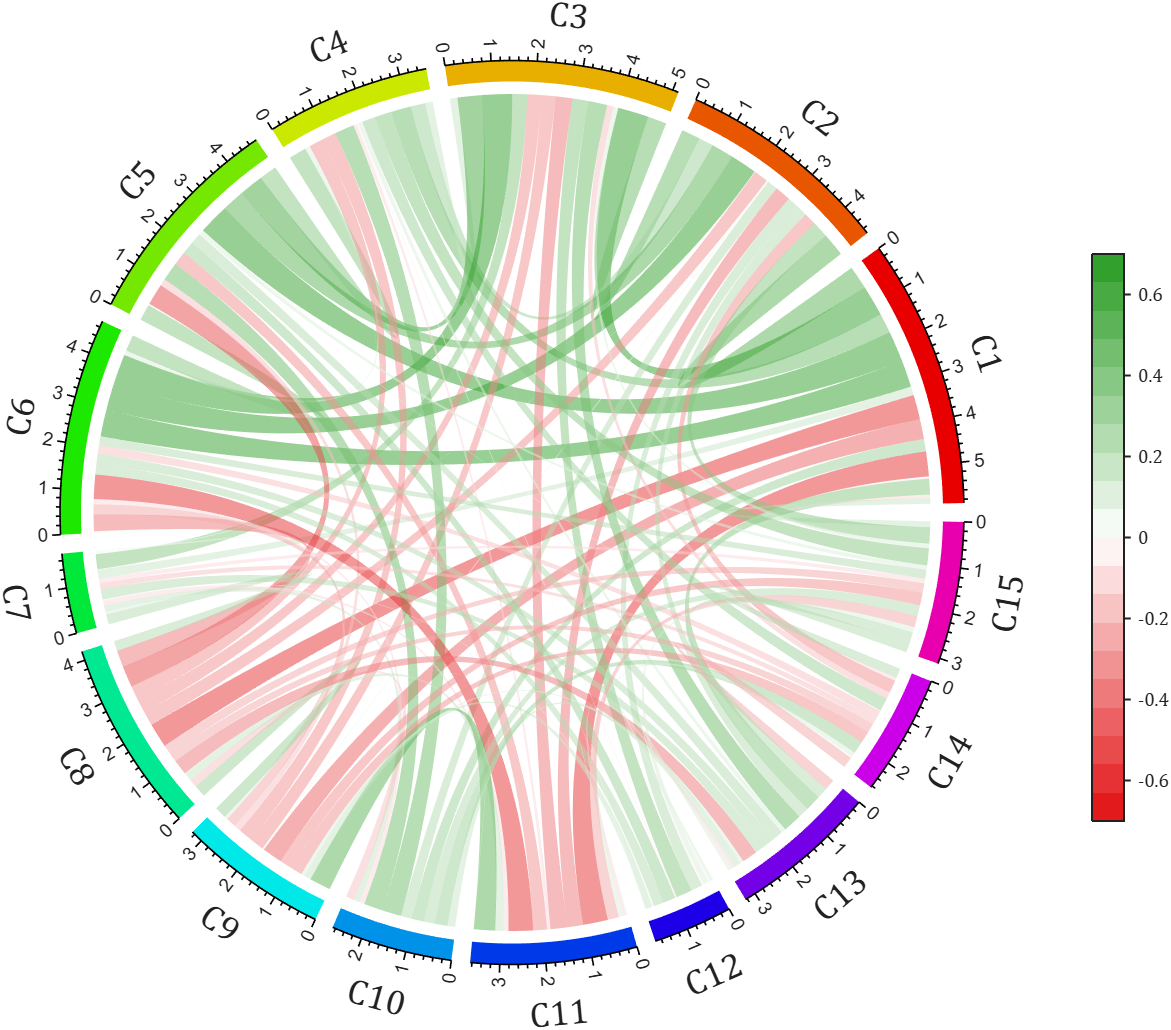
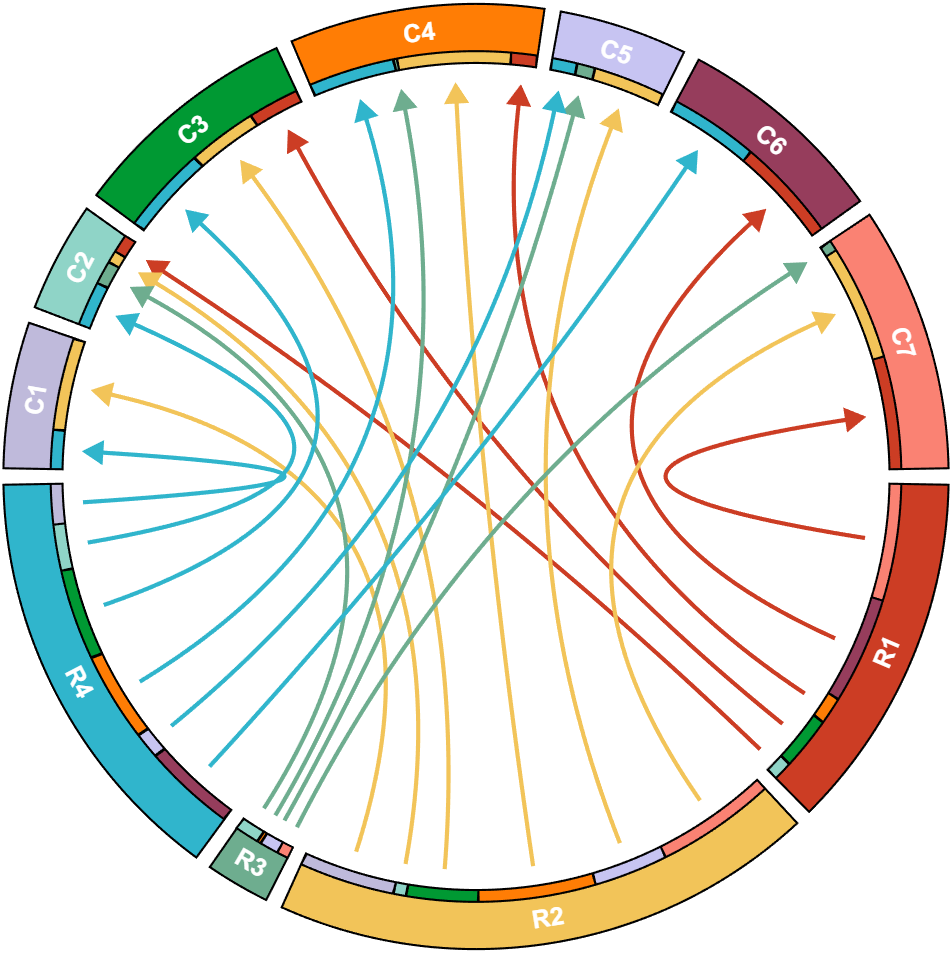
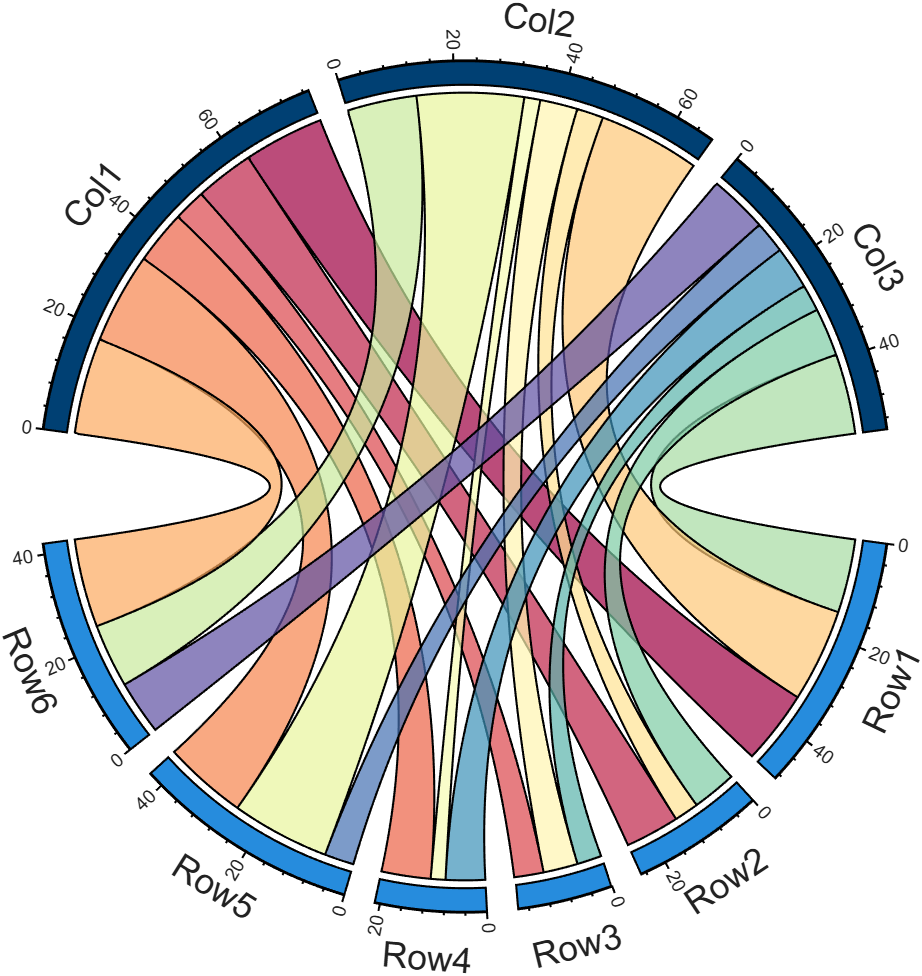
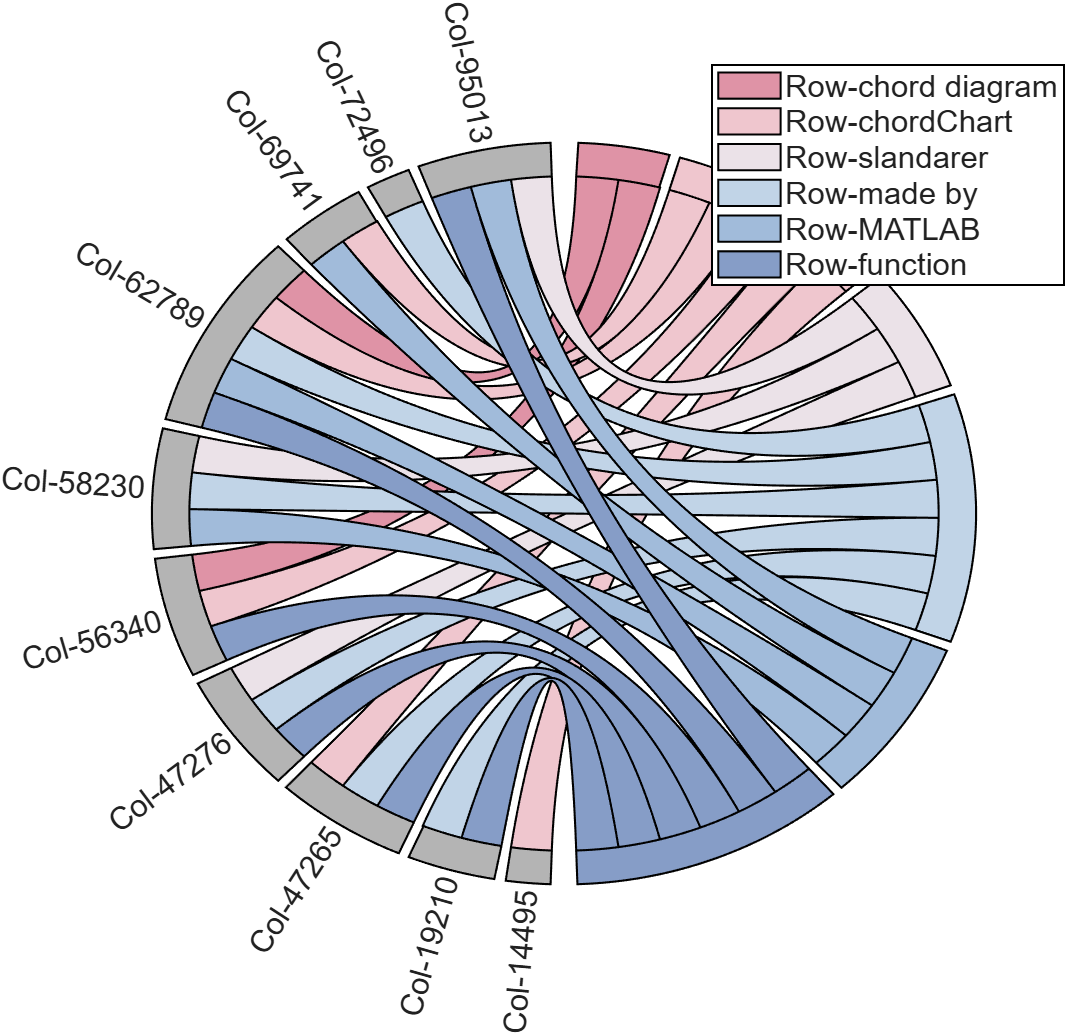
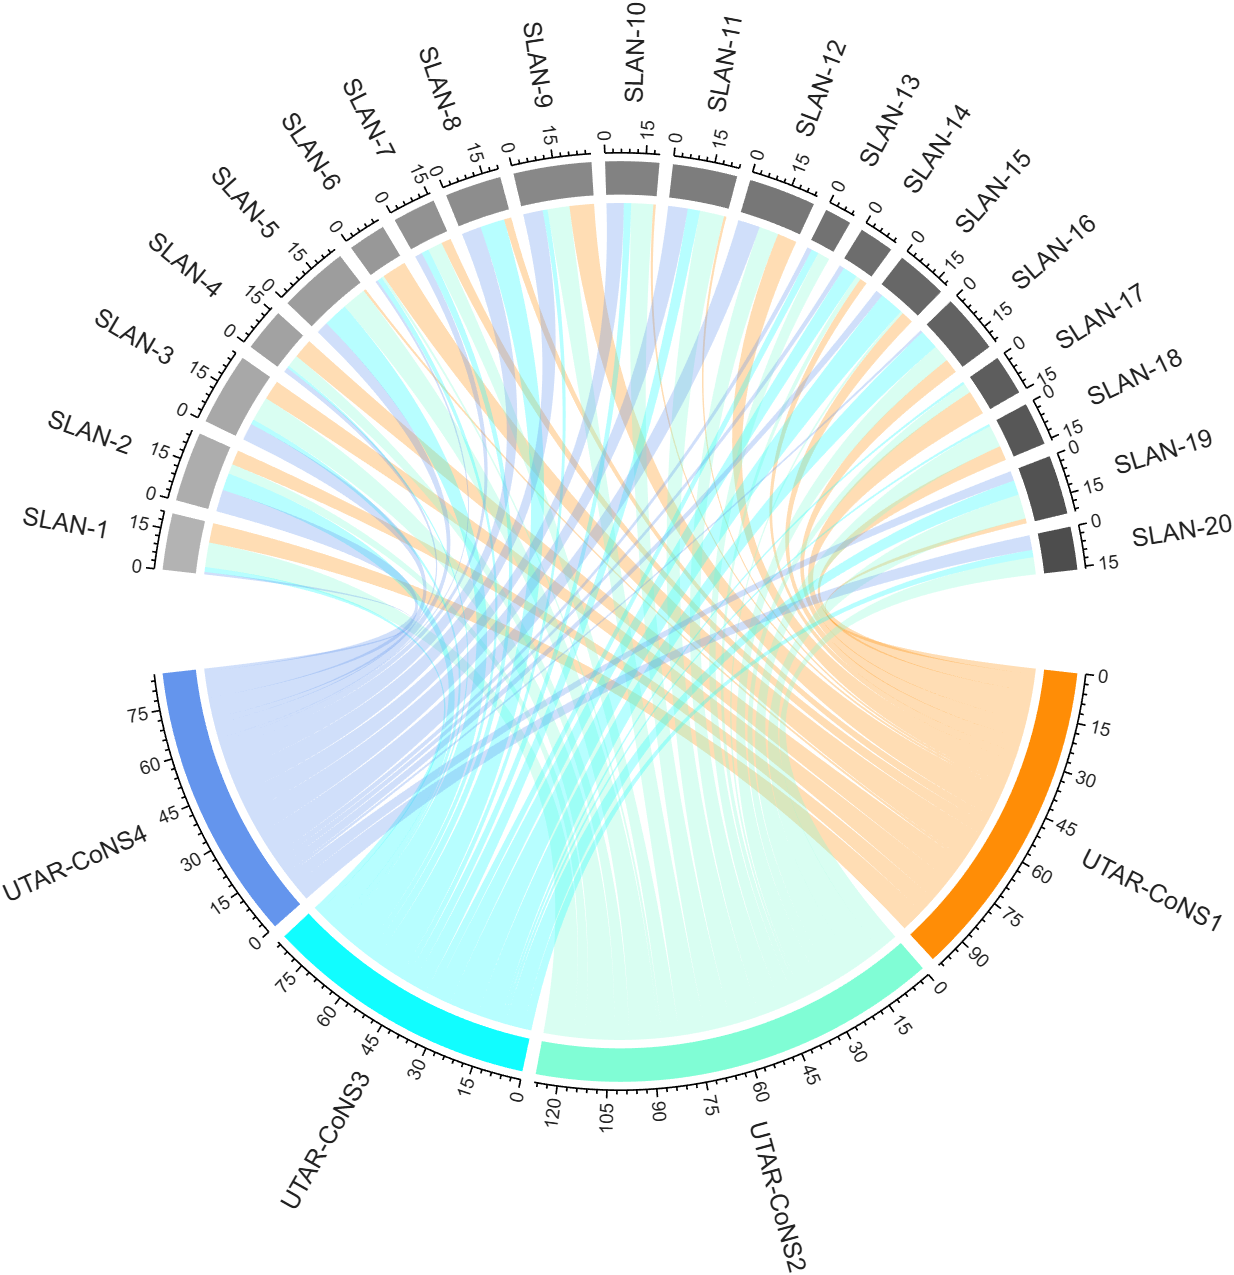
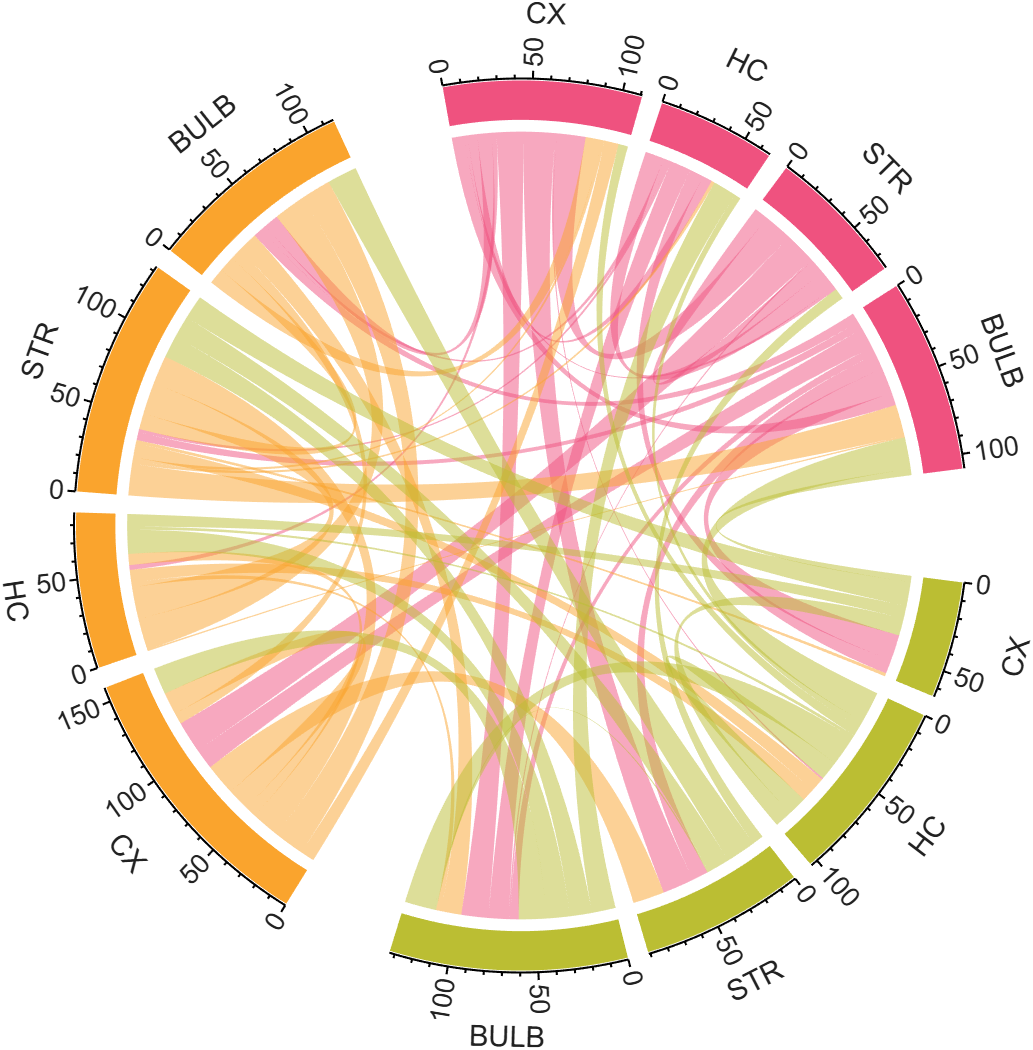
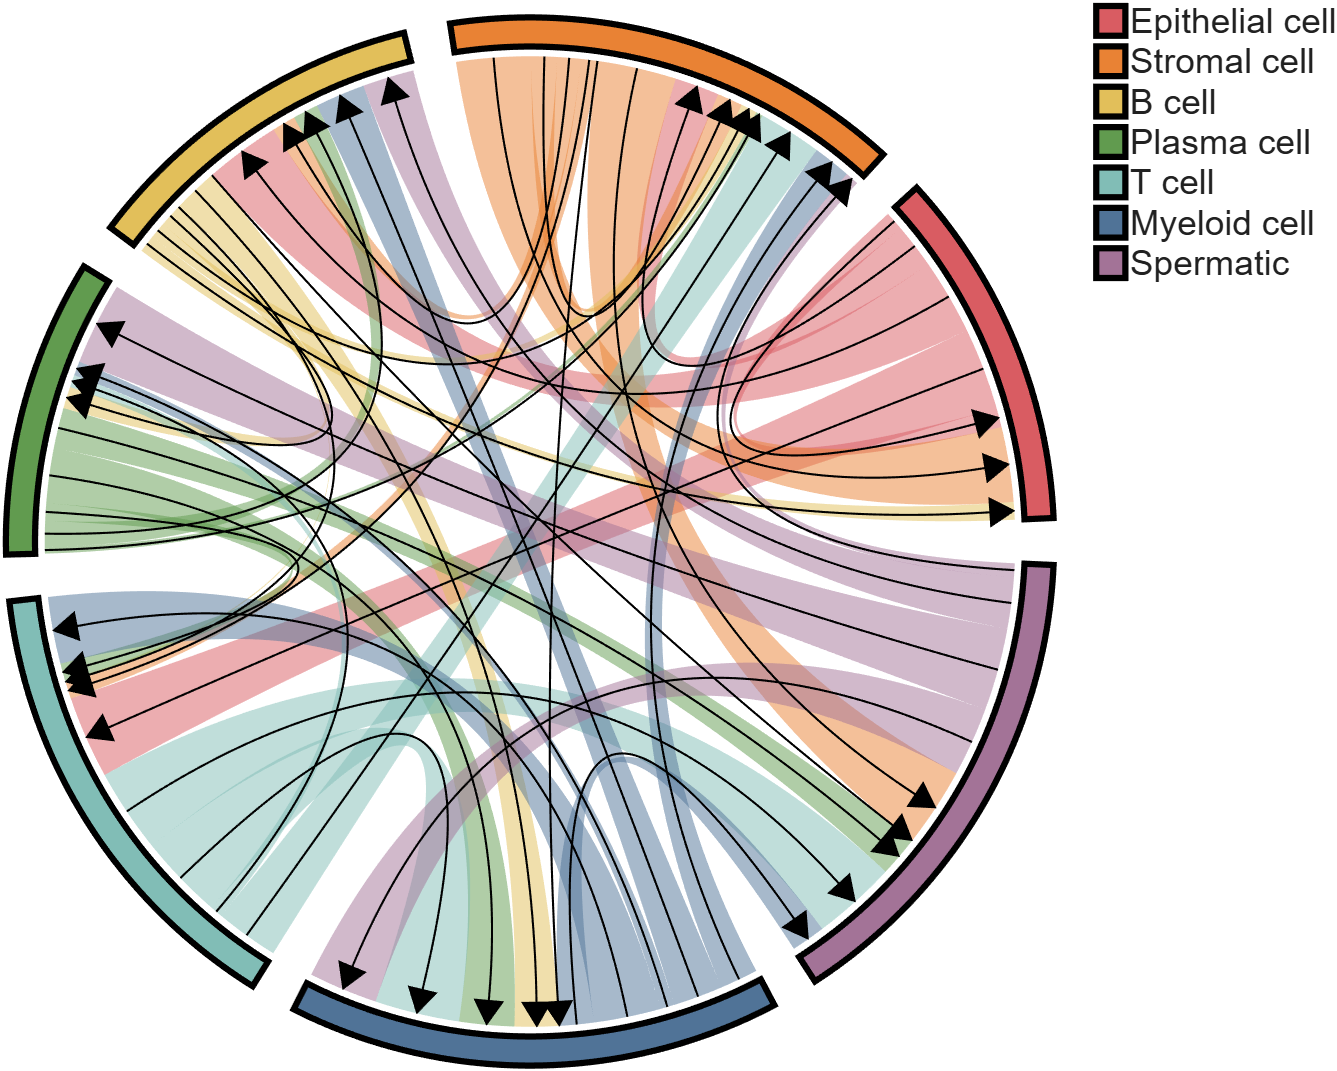
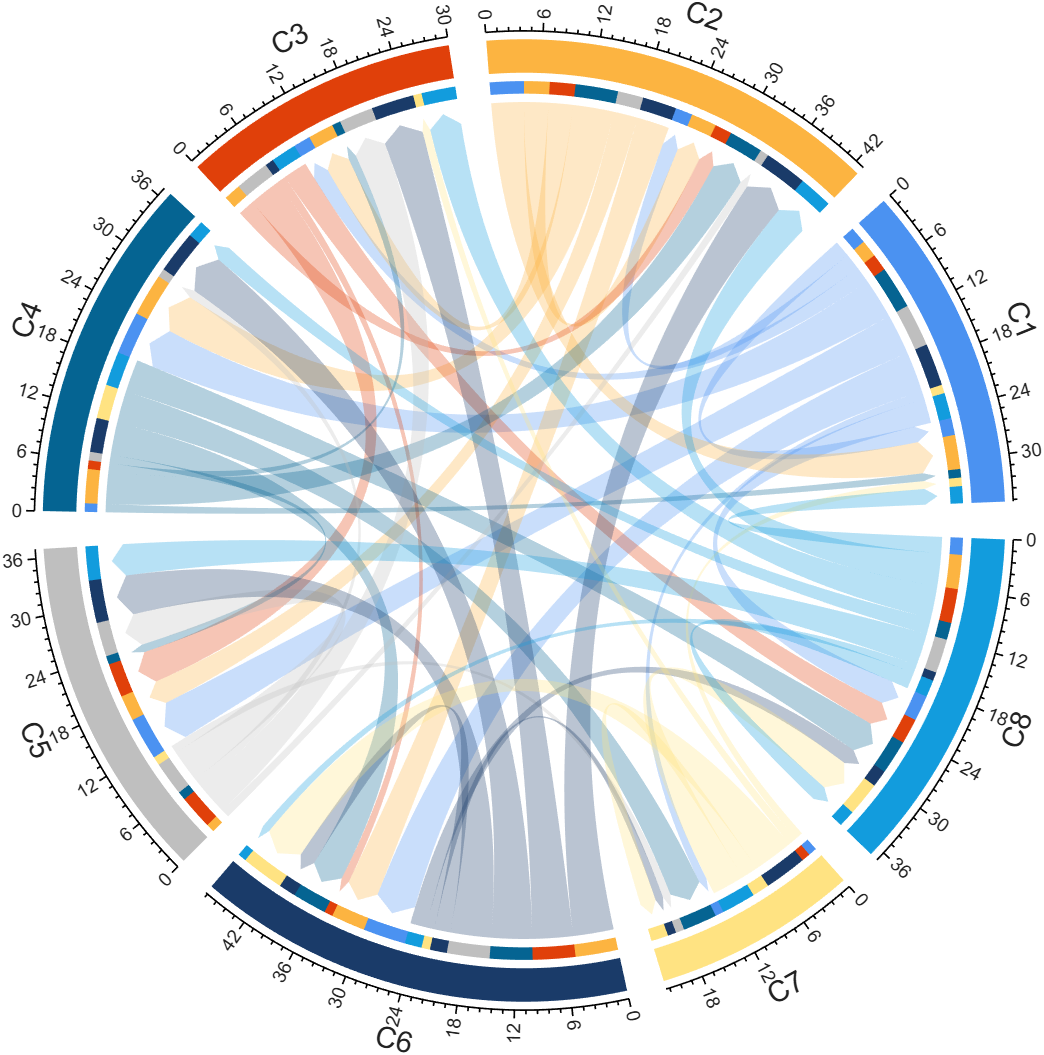
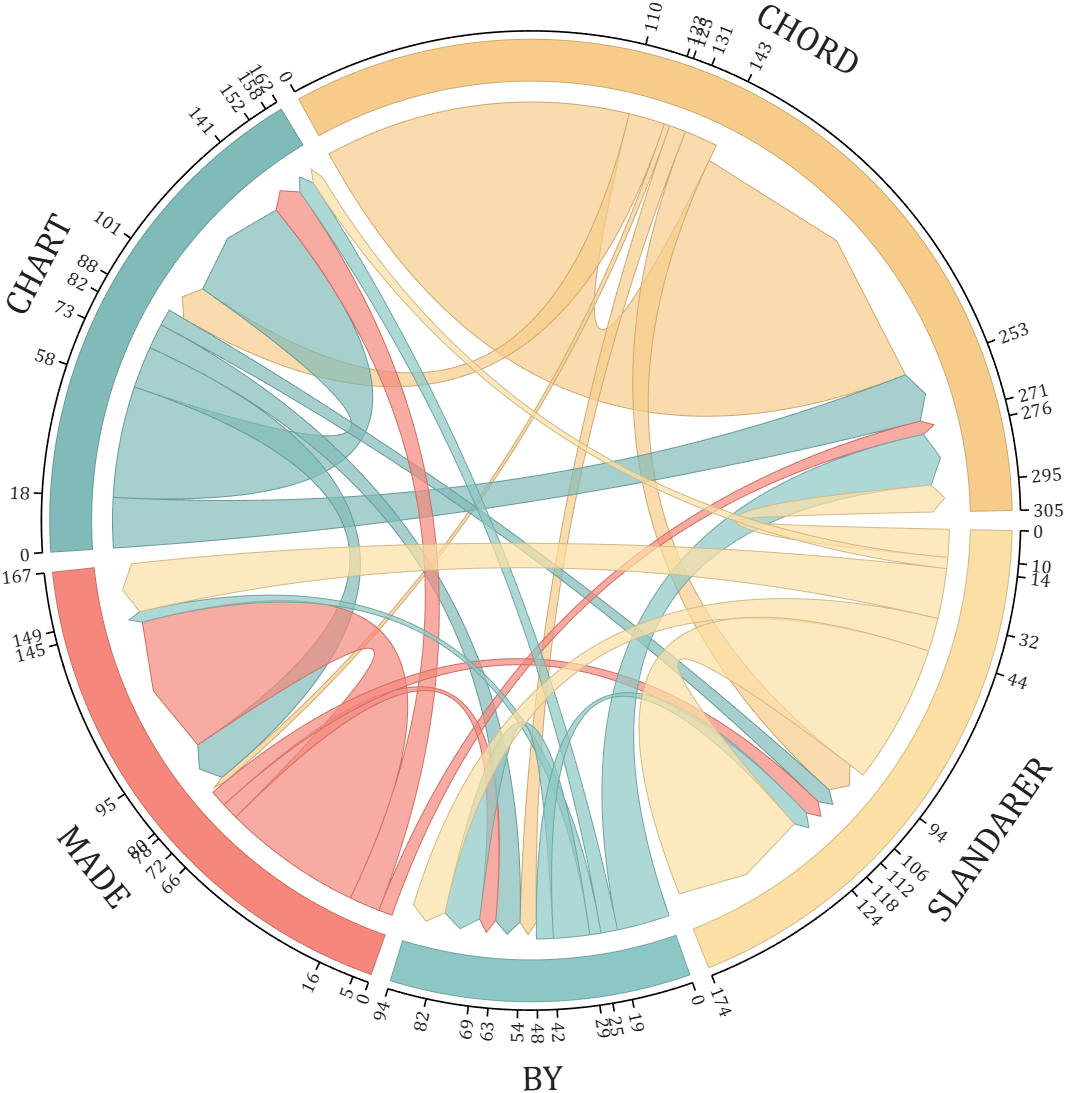
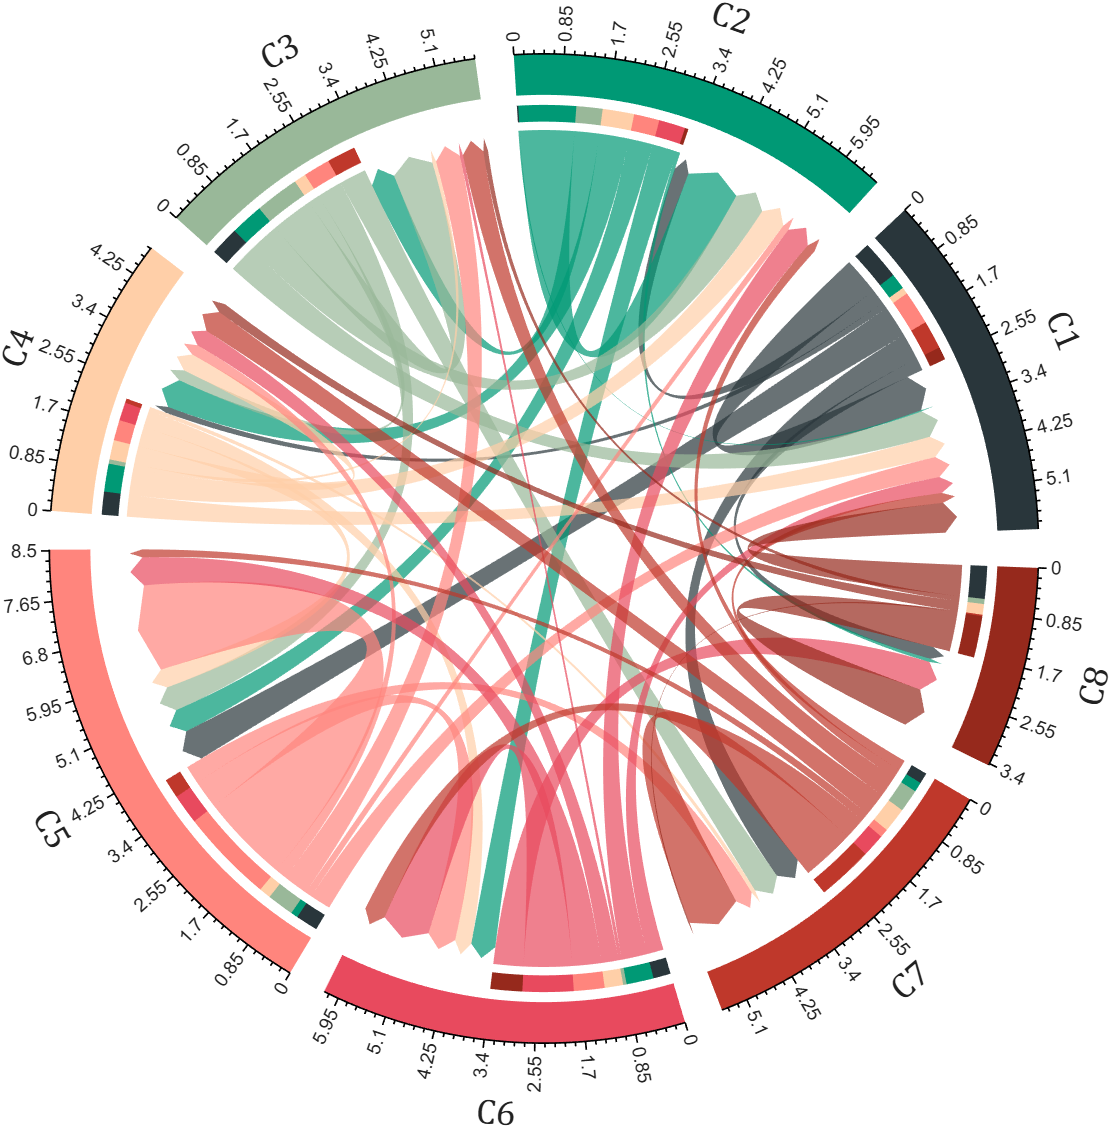
I developed two functions: one for plotting chord diagrams without self-loops, and the other for plotting chord diagrams with self-loops.
chordChart : basic usage
plotting chord diagrams without self-loops : https://www.mathworks.com/matlabcentral/fileexchange/116550-chordchart-chord-diagram
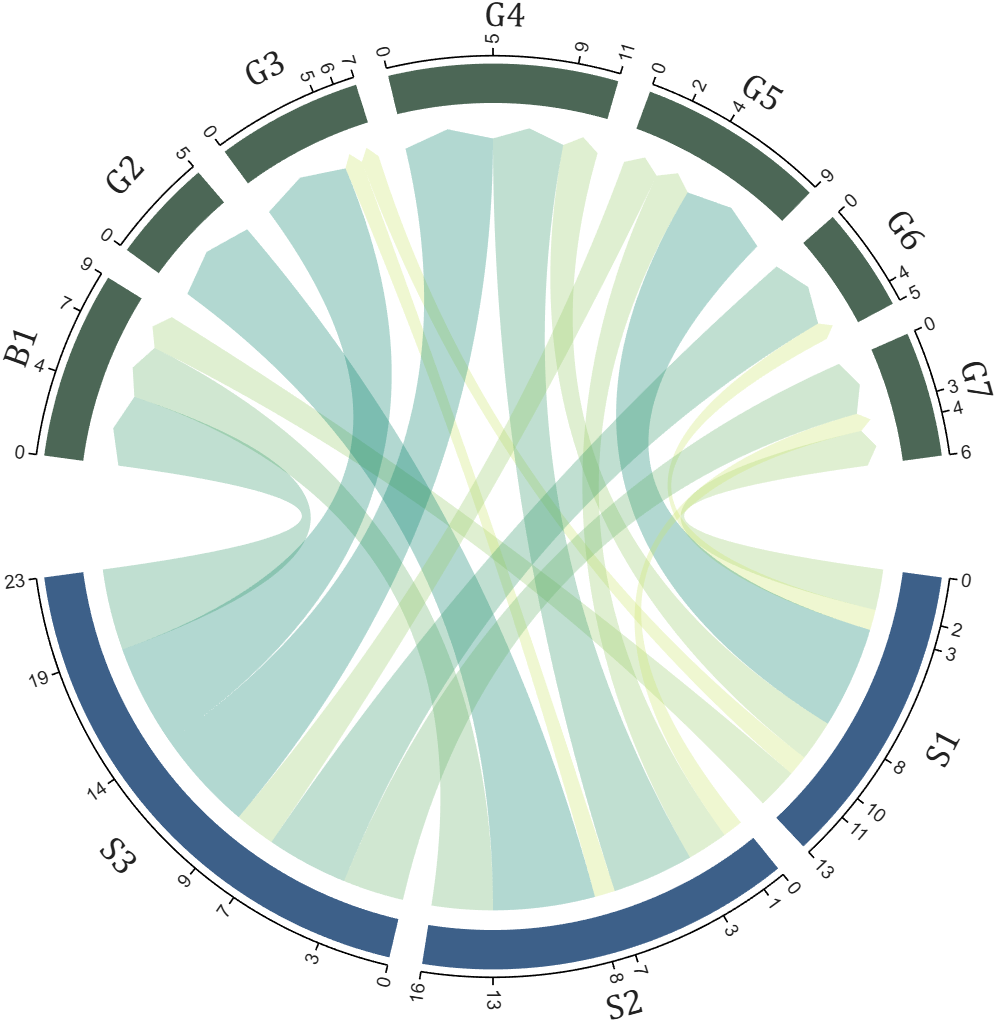
dataMat = [2 0 1 2 5 1 2;
3 5 1 4 2 0 1;
4 0 5 5 2 4 3];
colName = {'B1','G2','G3','G4','G5','G6','G7'};
rowName = {'S1','S2','S3'};
% Create and render chord diagram object (创建弦图对象并渲染)
CC = chordChart(dataMat, 'RowName',rowName, 'ColName',colName, 'Arrow','on');
CC.LinearMinorTick = 'on';
CC.draw();
% Set Font for labels and show ticks (调整字体并显示刻度)
CC.setFont('FontSize',17, 'FontName','Cambria')
CC.tickState('on')
CC.tickLabelState('on')
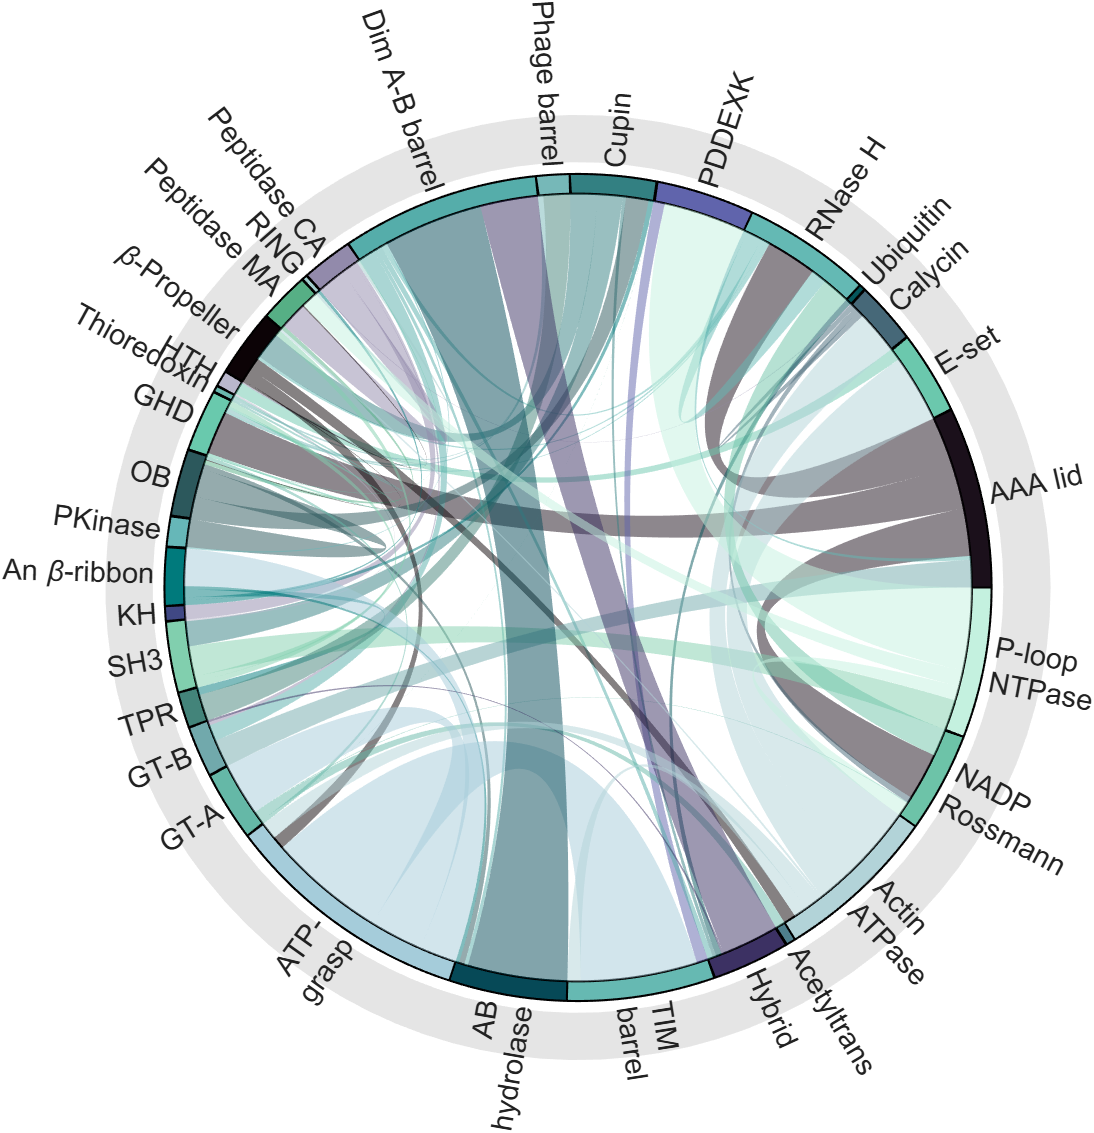
biChordChart : basic usage
plotting chord diagrams with self-loops : https://www.mathworks.com/matlabcentral/fileexchange/121043-bichordchart-bidirectional-chord-diagram
dataMat = randi([0,8], [5,5]);
nameList = {'AAA','BBB','CCC','DDD','EEE'};
% Create bichord chart object and draw (创建并绘制双向弦图对象)
BCC = biChordChart(dataMat, 'Arrow','on', 'Label',nameList);
BCC = BCC.draw();
% Show ticks and tick labels (添加刻度)
BCC.tickState('on')
BCC.tickLabelState('on')
% Set font properties (修改字体,字号及颜色)
BCC.setFont('FontName','Cambria','FontSize',17)
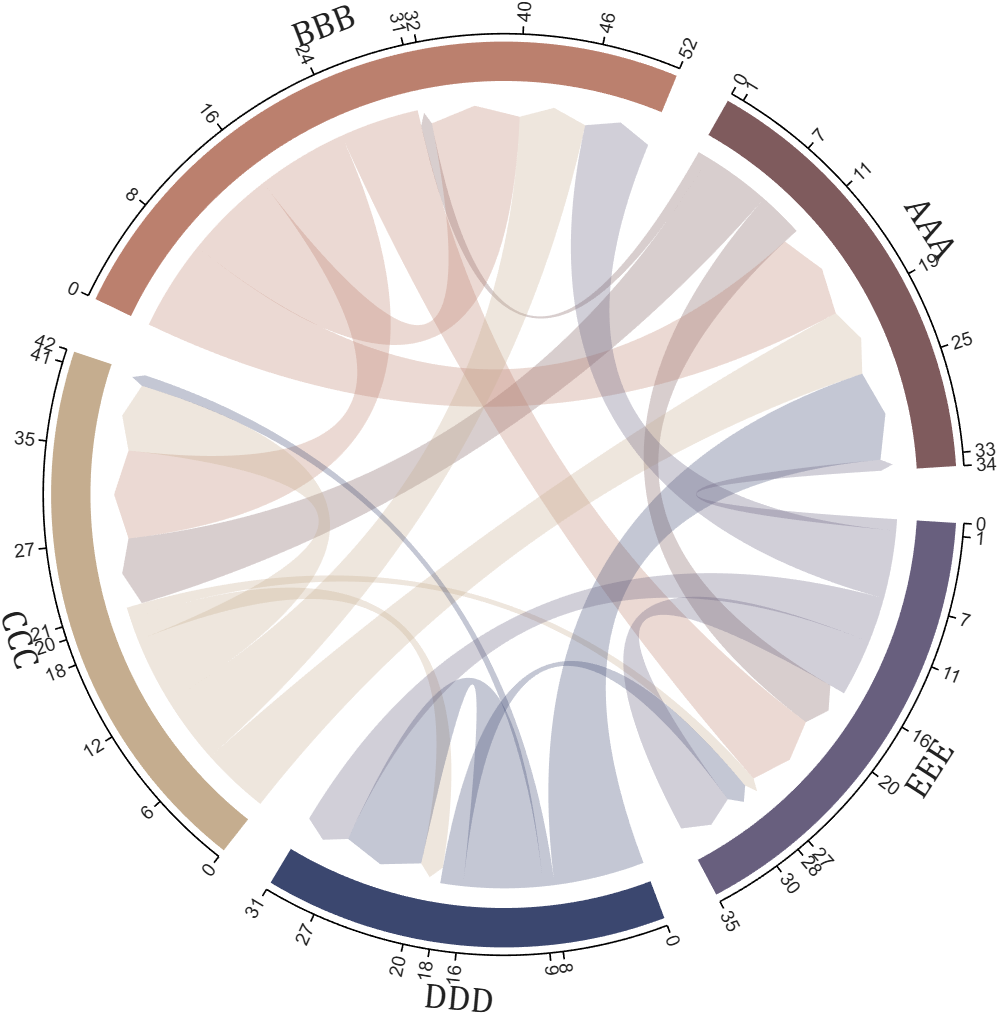
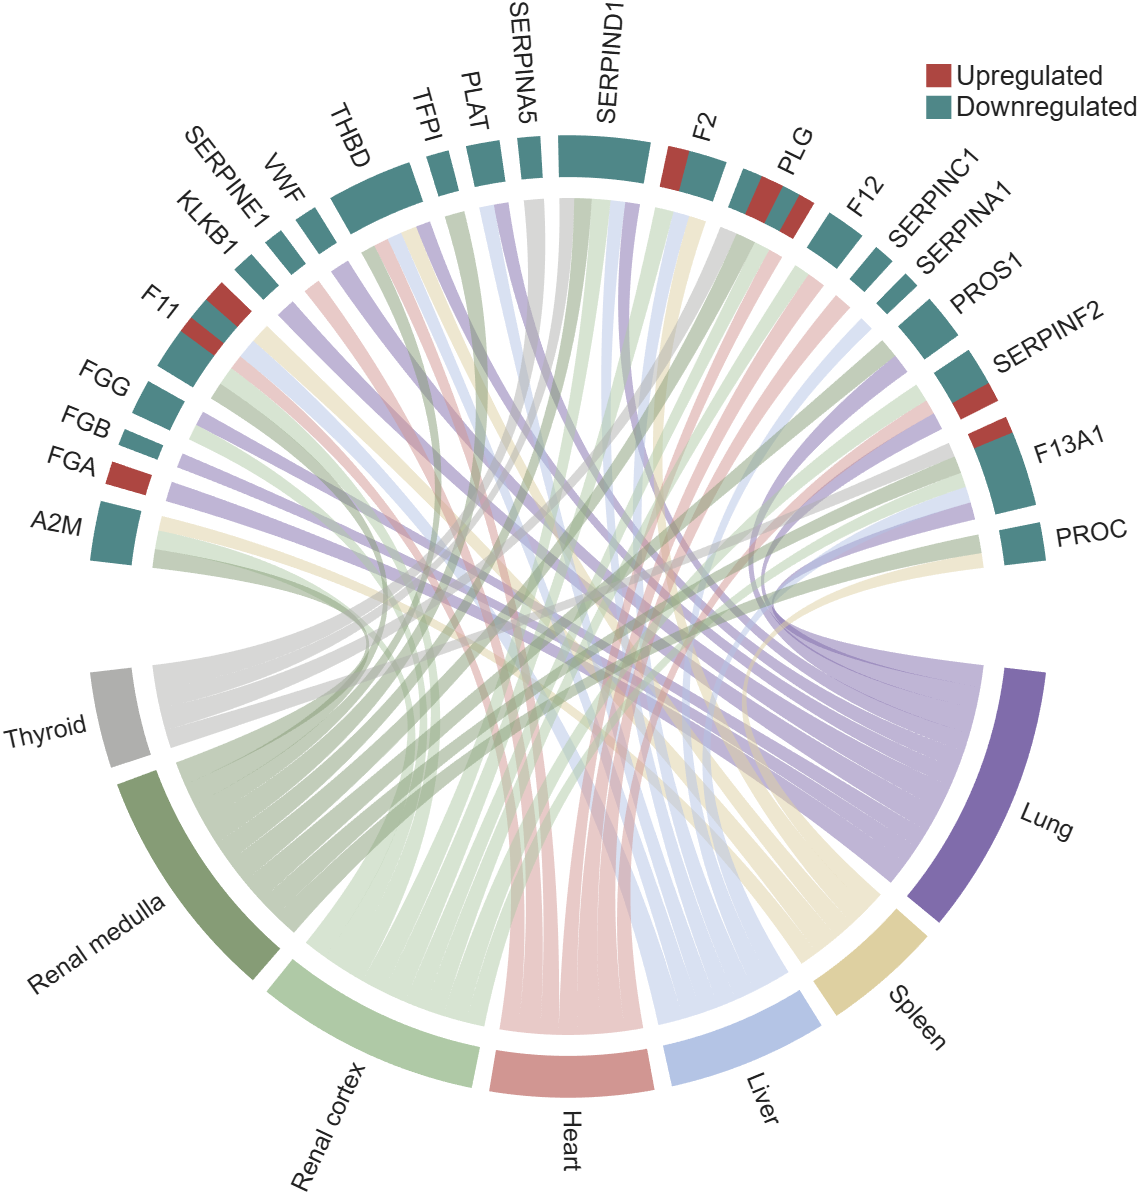
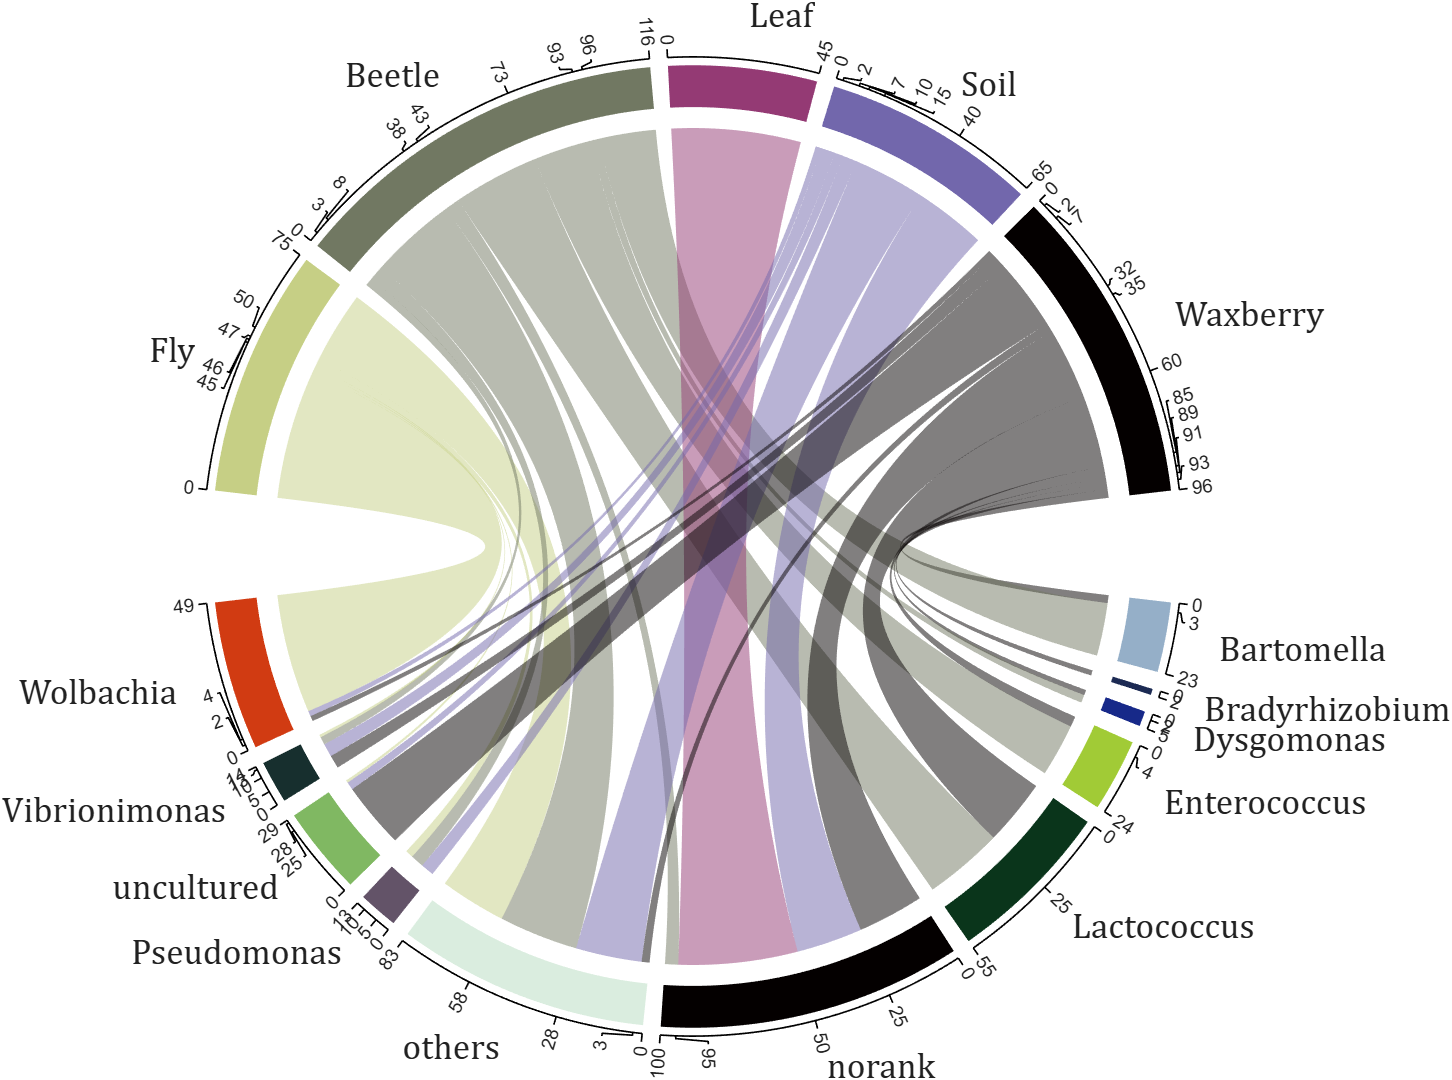
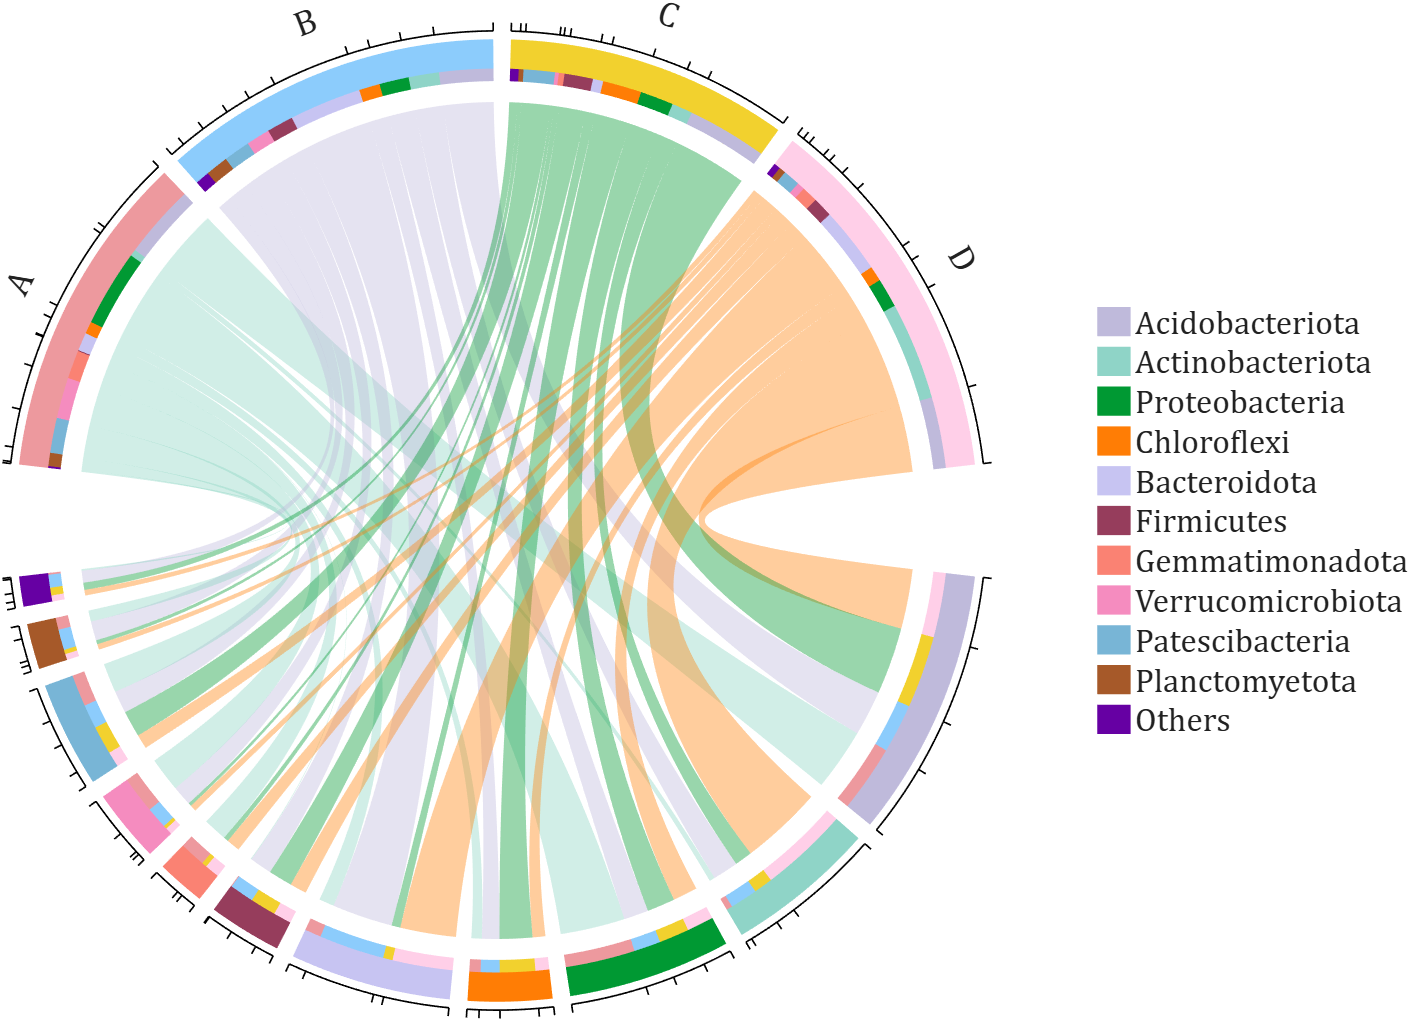
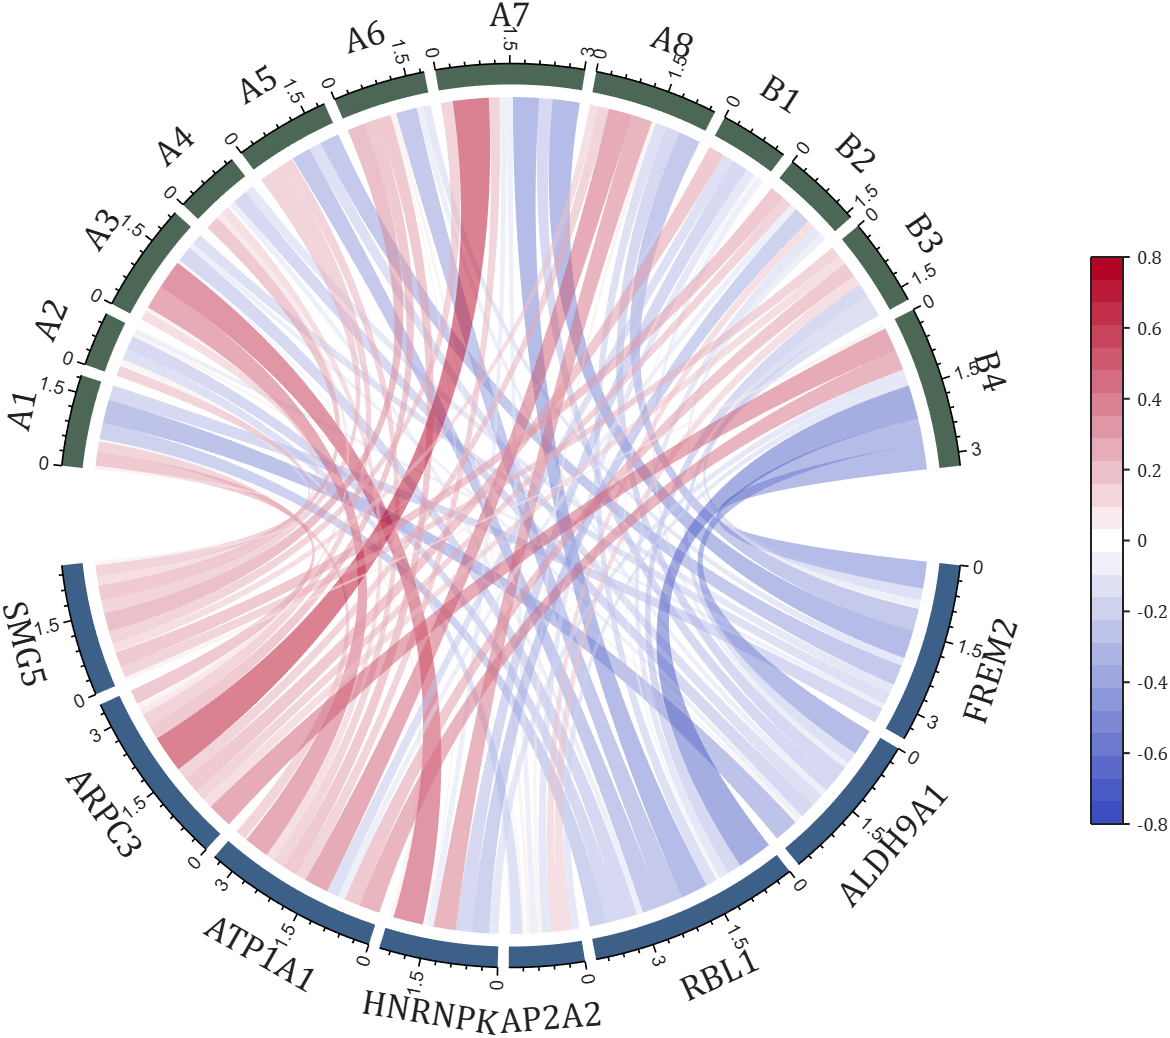
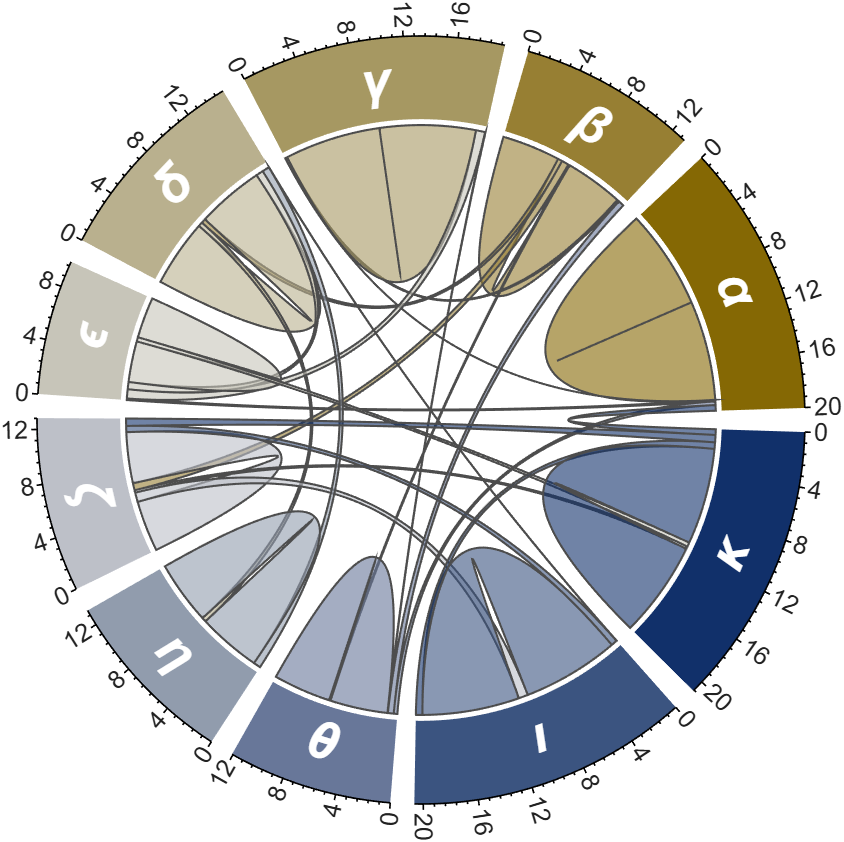
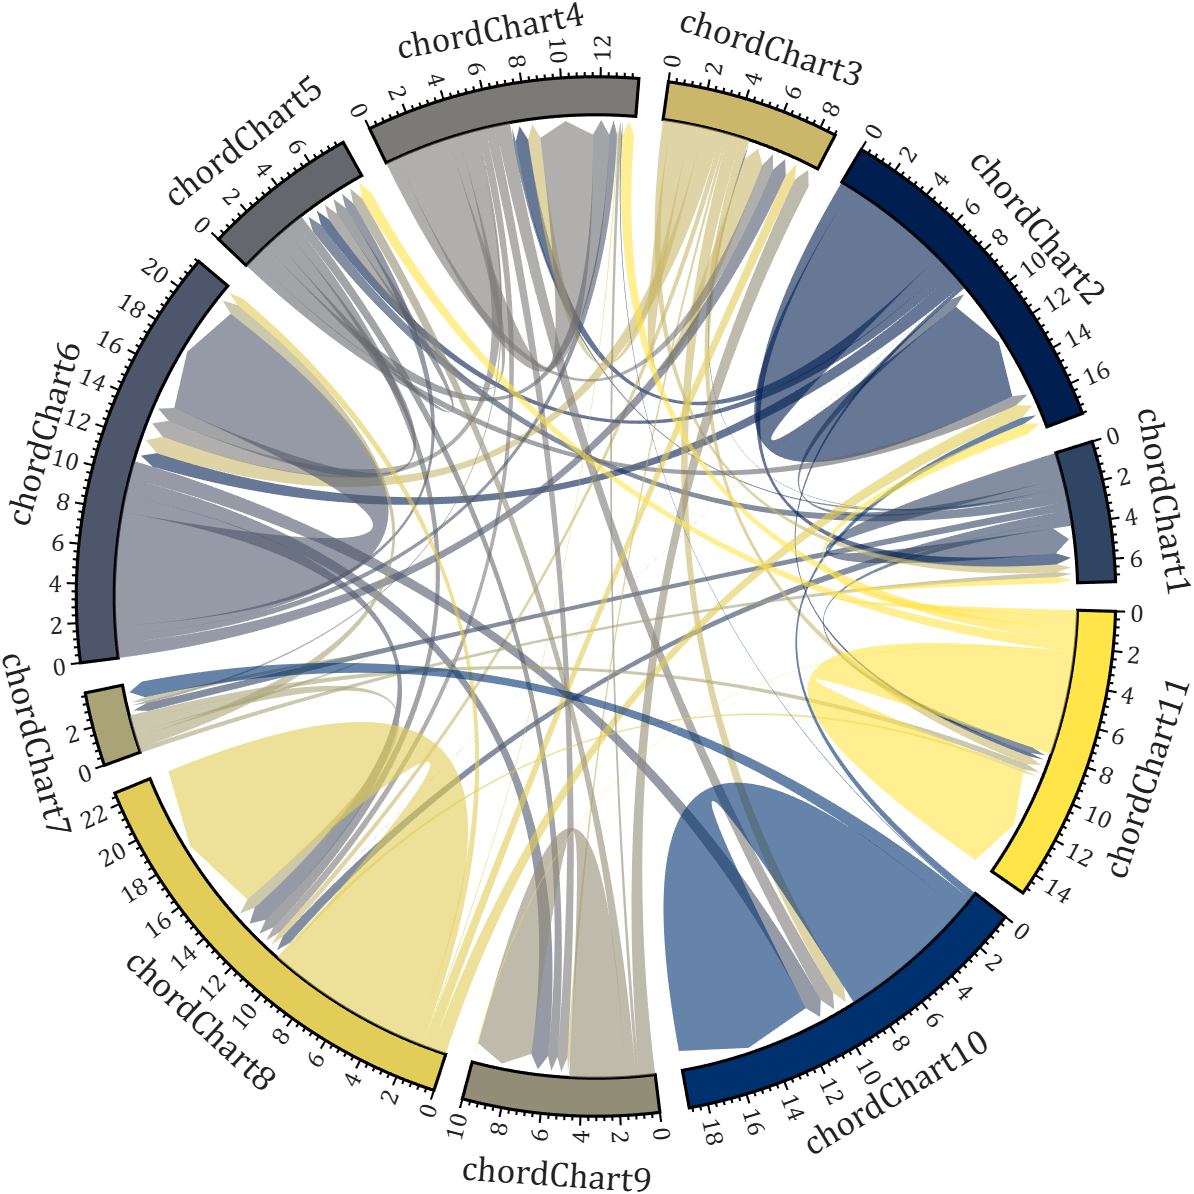
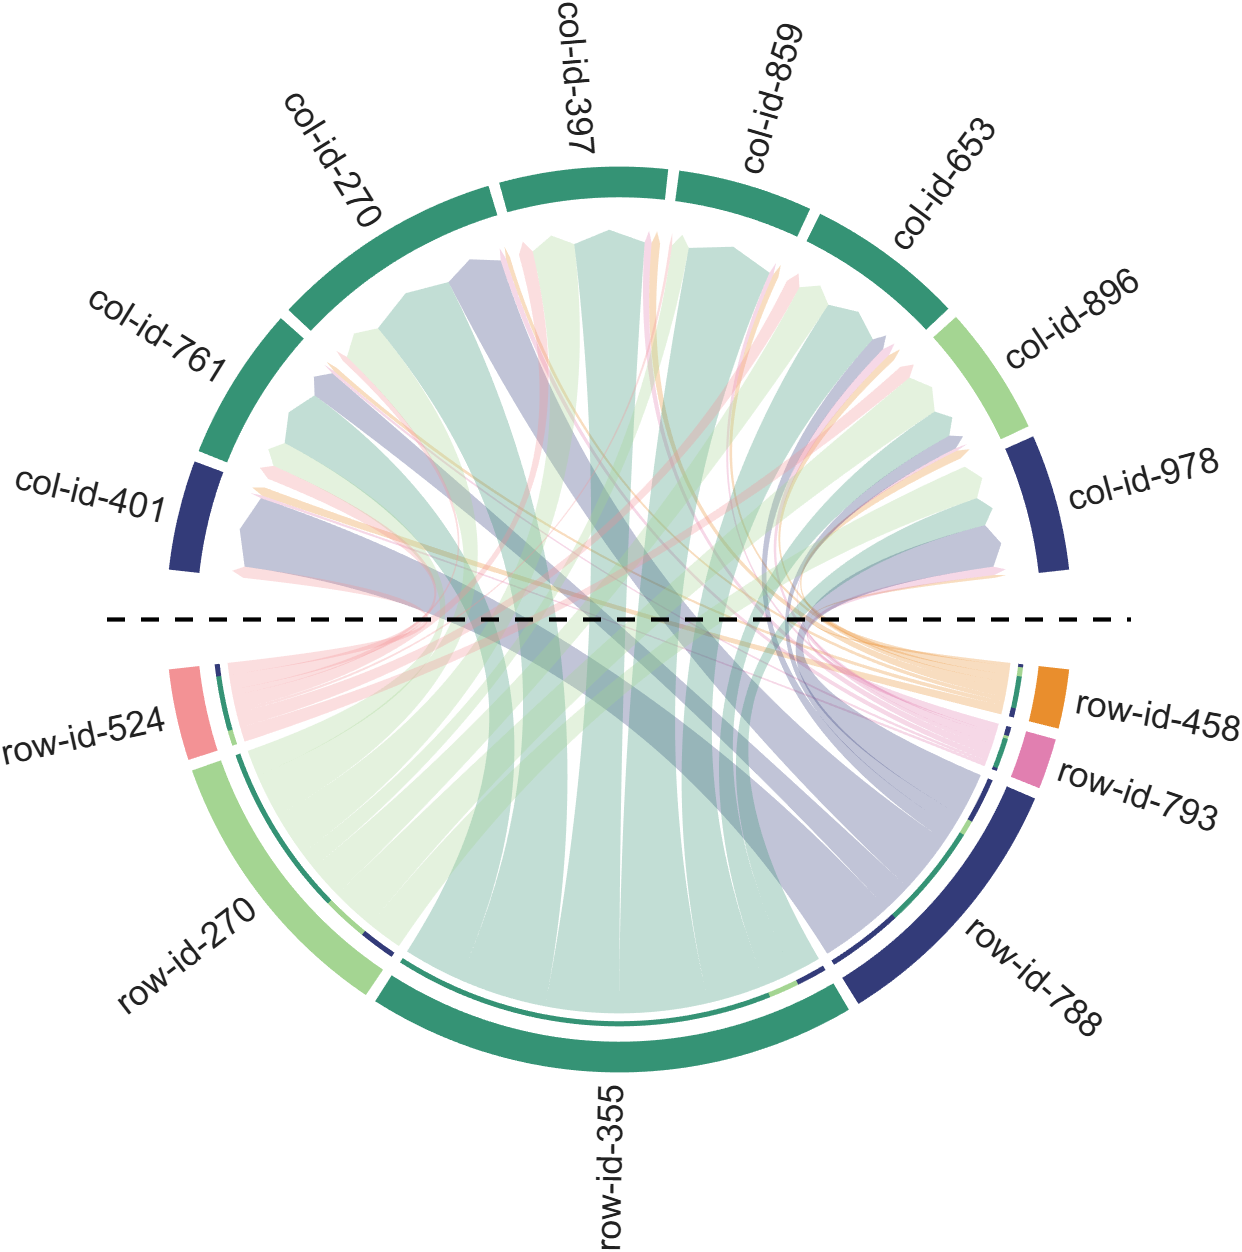
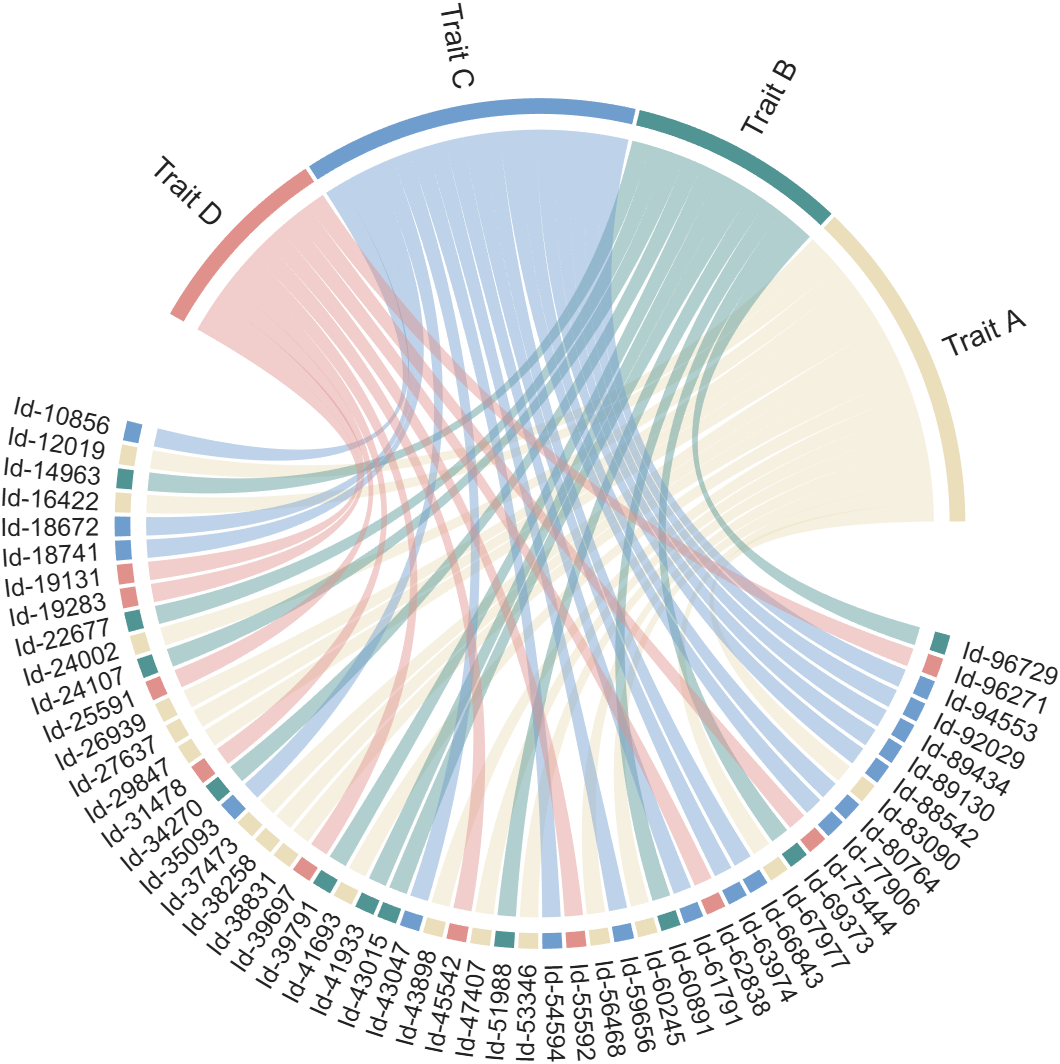
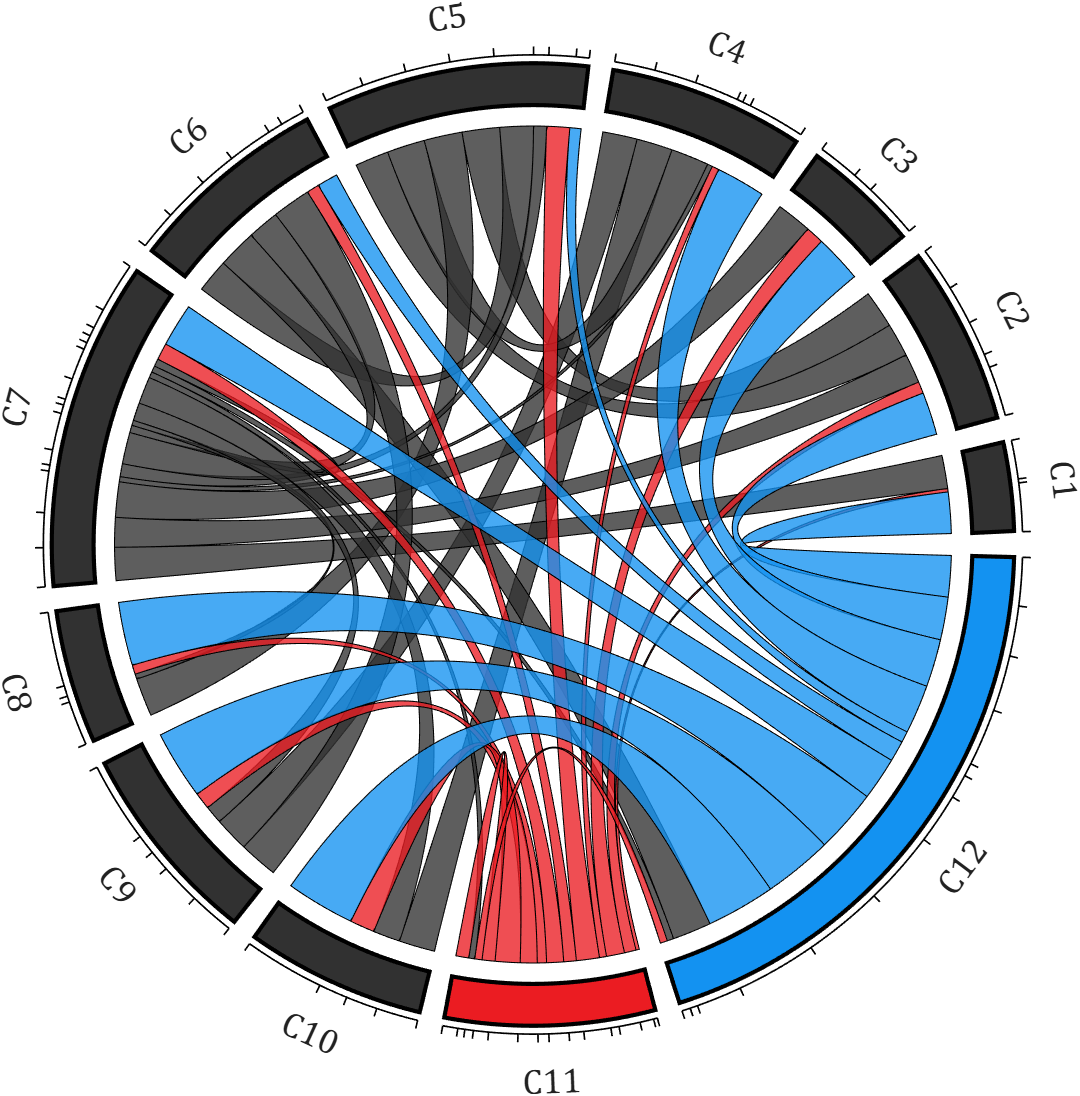
The two File Exchange submissions each provide more than a dozen basic examples. In addition, the GitHub repository listed below provides nearly 40 elaborate customized demonstration cases.
1 commentaire
Date décroissante
Connectez-vous pour participer
Tags
Discussions
Canaux de discussion

