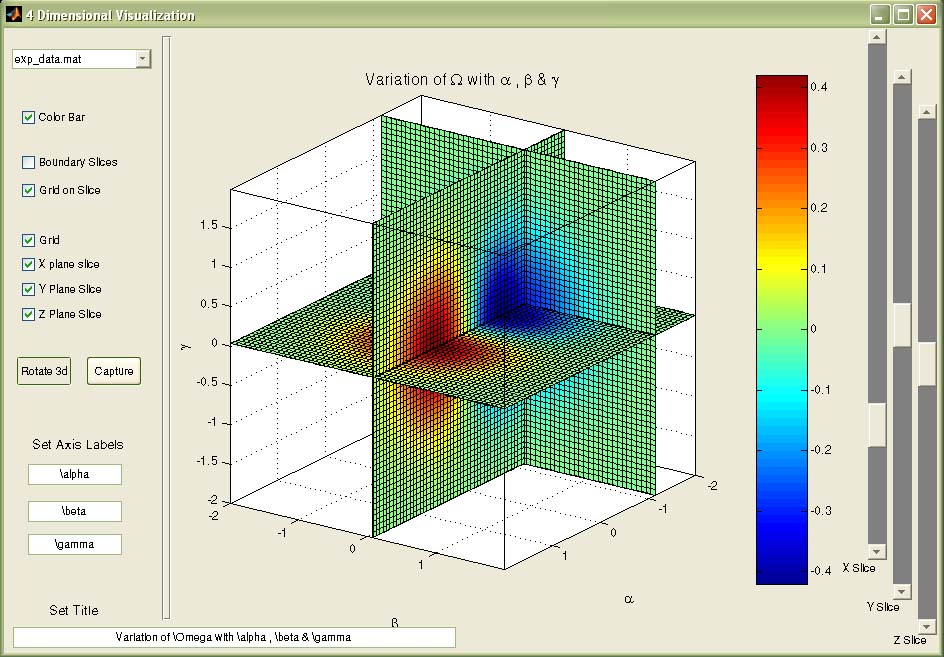
4 Dimensional visualization
This is to visualize the functions of 3 variables: z=f(x,y,t), which becomes 4 dimensional problem

Vous suivez désormais cette soumission
- Les mises à jour seront visibles dans votre flux de contenu suivi
- Selon vos préférences en matière de communication il est possible que vous receviez des e-mails
Citation pour cette source
J. Divahar (2026). 4 Dimensional visualization (https://fr.mathworks.com/matlabcentral/fileexchange/13503-4-dimensional-visualization), MATLAB Central File Exchange. Extrait(e) le .
Catégories
En savoir plus sur Creating and Concatenating Matrices dans Help Center et MATLAB Answers
Informations générales
- Version (2,18 Mo)
Compatibilité avec les versions de MATLAB
- Compatible avec toutes les versions
Plateformes compatibles
- Windows
- macOS
- Linux
| Version | Publié le | Notes de version | Action |
|---|---|---|---|
| 1.1.0 | Updated to make it work in non WINDOWS Operating Systems also by changing the path specification using "/" |
||
| 1.0.0 | "Error with Slider value" problem was rectified. Thanks to Ms.Srividya for her feedback about it. |

