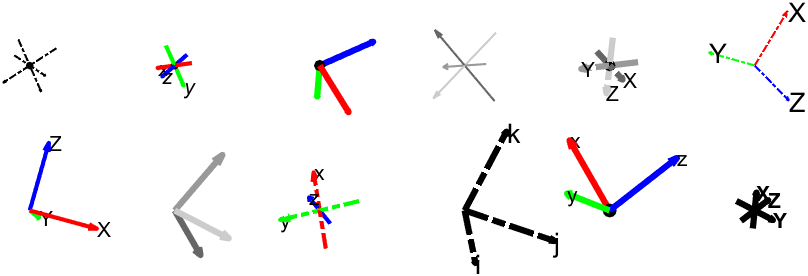
plotframe: Plot a 3-D Cartesian coordinate system
hg = plotframe( rotationMatrix, translationVector, basisVectorLengths, Name=Value )

Vous suivez désormais cette soumission
- Les mises à jour seront visibles dans votre flux de contenu suivi
- Selon vos préférences en matière de communication il est possible que vous receviez des e-mails
Citation pour cette source
George Abrahams (2023) (https://www.linkedin.com/in/georgeabrahams). plotframe: Plot a 3-D Cartesian coordinate system (https://github.com/WD40andTape/plotframe/releases/tag/1.0.0), GitHub. Retrieved December 14, 2023.
Informations générales
- Version (664 ko)
-
 Afficher la licence sur GitHub
Compatibilité avec les versions de MATLAB
- Compatible avec les versions R2020b et ultérieures
Plateformes compatibles
- Windows
- macOS
- Linux
| Version | Publié le | Notes de version | Action |
|---|---|---|---|
| 1.0.2 | See release notes for this release on GitHub: https://github.com/WD40andTape/plotframe/releases/tag/1.0.2 |
||
| 1.0.1 | See release notes for this release on GitHub: https://github.com/WD40andTape/plotframe/releases/tag/1.0.1 |
||
| 1.0.0 |
Pour consulter ou signaler des problèmes liés à ce module complémentaire GitHub, accédez au dépôt GitHub.
Pour consulter ou signaler des problèmes liés à ce module complémentaire GitHub, accédez au dépôt GitHub.

