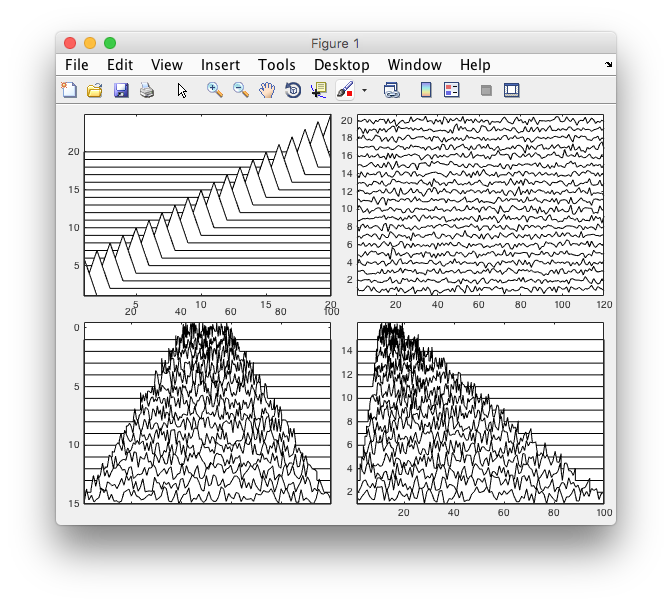
Stacked line plot
Stacked line plots from a matrix or vectors

Vous suivez désormais cette soumission
- Les mises à jour seront visibles dans votre flux de contenu suivi
- Selon vos préférences en matière de communication il est possible que vous receviez des e-mails
Citation pour cette source
Christopher Hummersone (2026). Stacked line plot (https://github.com/IoSR-Surrey/MatlabToolbox), GitHub. Extrait(e) le .
Informations générales
- Version (156 ko)
-
 Afficher la licence sur GitHub
Compatibilité avec les versions de MATLAB
- Compatible avec toutes les versions
Plateformes compatibles
- Windows
- macOS
- Linux
| Version | Publié le | Notes de version | Action |
|---|---|---|---|
| 2.1.1 | Migrated to GitHub. |
||
| 2.1.0 | Added option to reverse y-axis direction. |
||
| 2.0.0 | Reconfigured interface. Added horizon options and support for vector inputs. |
||
| 1.10.0 | Minor tweak to how y-axis min is calculated. |
||
| 1.9.0 | Corrected two bugs: one where scale would be recursively updated depending on magnitude order in wave, and the other where y axis min was erroneous if gain was set. |
||
| 1.8.0 | Added trap for cases where input contents are all zero (or, at least one row is). |
||
| 1.7.0 | Corrected ylim so that top row is not cropped when gain is applied. |
||
| 1.5.0 | Some bug fixes and efficiency savings. Updated documentation. |
||
| 1.4.0 | Minor updates to example and validation; new screenshot. |
||
| 1.3.0 | Tidied up, updated description |
||
| 1.2.0 | Ooops, forgot to check the MODE argument |
||
| 1.1.0 | Added optional plotting mode argument: 'fill' or 'plot'. 'plot' is useful for fine structure plotting, 'fill' is useful for correlograms. Tidied up input validation. |
||
| 1.0.0 |

