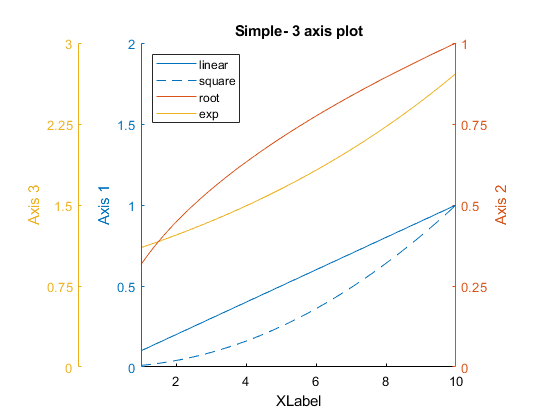
plotNAx
plotNAx is a plotting utility which can graph data (with formatting) across multiple y-axis with a shared x-axis.

Vous suivez désormais cette soumission
- Les mises à jour seront visibles dans votre flux de contenu suivi
- Selon vos préférences en matière de communication il est possible que vous receviez des e-mails
Citation pour cette source
Rohan Kadambi (2026). plotNAx (https://fr.mathworks.com/matlabcentral/fileexchange/85598-plotnax), MATLAB Central File Exchange. Extrait(e) le .
Remerciements
Inspiré par : plotyyy, addaxis, Plot with multiple Y-axes
Informations générales
- Version (11,5 ko)
Compatibilité avec les versions de MATLAB
- Compatible avec toutes les versions
Plateformes compatibles
- Windows
- macOS
- Linux
| Version | Publié le | Notes de version | Action |
|---|---|---|---|
| 1.2.0 | Supressed output from axes set command. Updated inner y-axis to copy tick labels on construction. [2020-02-08, RPK] |
||
| 1.1.3 | % 1.1.3 - Fixed thumbnail image on mathworks file exchange
|
||
| 1.1.2 | % 1.1.2 - Fixed thumbnail image on mathworks file exchange
|
||
| 1.1.1 | % 1.1.1 - Removed internal bug tracking from published file.
|
||
| 1.1.0 | % 1.1.0 - Fixed bug in layering of axes covering the "colored" y-axis of
|
||
| 1.0.0 |

