
Draw a line with an arrowhead.
ARROW (5/02/2023) Draw a line with an arrowhead.ARROW(Start,Stop) draws a line with an arrow from Start to Stop (points should be vectors of length 2 or 3, or matrices with 2 or 3 columns), and
- 102,2K (depuis toujours)
- 49 (30 derniers jours)
- 4,7 / 5
- Communauté
-
3 mai 2023

Draws lines with directional arrowheads.
ARROW3(P1,P2) draws lines from P1 to P2 with directional arrowheads. P1 and P2 are either nx2 or nx3 matrices. Each row of P1 is an initial point, and each row of P2 is a terminal
- 25,7K (depuis toujours)
- 36 (30 derniers jours)
- 4,8 / 5
- Communauté
-
8 août 2020

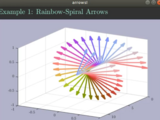
mArrow3.m - easy-to-use 3D arrow
Draw a 3D arrow. Easily specify size, color and even transparency.
This function draws a 3D arrow using a cylinder and cone patch. This allows the use of all patch properties including transparency. It can be used with default parameters (example 1) or user-defined
- 10,1K (depuis toujours)
- 16 (30 derniers jours)
- 4,7 / 5
- Communauté
-
21 sept. 2009

3D Arrow with many color/parameter options
Create a single 3D arrow in a volumized format
This code allows you to create simple, yet powerful three dimensional arrow. As it is derived from the surf command, it may be memory intensive, but well worth the cost for crisp visualization of
- 5,2K (depuis toujours)
- 6 (30 derniers jours)
- 4,7 / 5
- Communauté
-
18 sept. 2006

This is a function designed to draw a circular arrow onto the current figure.
This function will draw a circular arrow onto the figure supplied by the figure handler. The radius, angle, orientation angle, colour and arrow head type can all be specified. There is also included
- 2,1K (depuis toujours)
- 7 (30 derniers jours)
- 5,0 / 5
- Communauté
-
24 oct. 2016

Creates curved vector fields or "tuft" lines to look like wind tunnel tuft flow visualization.
H = STREAKARROW(X,Y,U,V,np,arrow) creates "curved" vectors, from 2D vector data U and V. All vectors have the same length. The magnitude of the vector is color coded. The arrays X and Y defines the
- 3,3K (depuis toujours)
- 3 (30 derniers jours)
- 5,0 / 5
- Communauté
-
1 déc. 2008

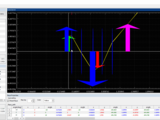
3D Quiver with volumized arrows
Produce a 3D quiver of arrows with many visualization options
arrows to more accurately portray your results with true, three-dimensional arrows. hQ = quiver3D(posArray, magArray, colorArray);% Returns the arrow handles (stem and arrow head separate for more
- 4K (depuis toujours)
- 4 (30 derniers jours)
- 5,0 / 5
- Communauté
-
18 sept. 2006

- 3,4K (depuis toujours)
- 3 (30 derniers jours)
- 5,0 / 5
- Communauté
-
28 juil. 2010

Combines line plotting with annotation arrows.
### line2arrow.m Documentation[
ARROWS: generalized and vectorized 2-D arrows plot
Vectorized and flexible arrow plot function in 2-D
This little function is an alternative to other existing arrow plot functions, since it has very simple, vectorized and effective coding. In fact, arrows are all plotted with a single patch command
- 2,2K (depuis toujours)
- 4 (30 derniers jours)
- 4,3 / 5
- Communauté
-
23 juin 2020

This function plots a line vector with arrow head.
Arrowline 3-D vector plot.vectarrow(p0,p1) plots a line vector with arrow pointing from point p0 to point p1. The function can plot both 2D and 3D vector with arrow depending on the dimension of the
- 42,6K (depuis toujours)
- 3 (30 derniers jours)
- 3,8 / 5
- Communauté
-
20 avr. 2005

Real Time GPS and data tracker application for the #matlab4mobile contest
Real Time GPS and data tracker for the #matlab4mobile contest. All files you need are included.
- 703 (depuis toujours)
- 2 (30 derniers jours)
- 5,0 / 5
- Communauté
-
31 mai 2017
- 829 (depuis toujours)
- 7 (30 derniers jours)
- 5,0 / 5
- Communauté
-
5 sept. 2020
Plots matlab quiver with log scaling while maintaining proper arrows directions.
Normally when using quiver, the arrows' size change linearly with the data. However, sometimes the data will appear more naturally in a logarithmic scale, and plotting this is not possible using
- 326 (depuis toujours)
- 3 (30 derniers jours)
- 5,0 / 5
- Communauté
-
15 oct. 2018

The kinematics toolbox is intended for prototyping robotics and computer vision related tasks.
- 23,5K (depuis toujours)
- 6 (30 derniers jours)
- 4,9 / 5
- Communauté
-
15 juil. 2009

Continuum undergoing combined elasto-plasto-damage transformation.
Time-dependent evolution of the continuum undergoing combined elasto-plasto-damage transformation.
- 1,2K (depuis toujours)
- 3 (30 derniers jours)
- 5,0 / 5
- Communauté
-
26 juin 2017

Phase Portrait Plotter on 2D phase plane
This function could plot the phase portrait of the 2-dimentional autonomous system, and is configurable for arrows, vector fileds, etc.
saddle to know where the region of attraction (ROA) is. Therefore, we set the input argument 'plotNonSaddleTrajectory' be false. We also set the solver region be for and for , and set the minimum arrow
- 5,3K (depuis toujours)
- 101 (30 derniers jours)
- 5,0 / 5
- Communauté
-
15 mai 2022

- 3,5K (depuis toujours)
- 1 (30 derniers jours)
- 5,0 / 5
- Communauté
-
10 mai 2009

very simple customizable inline function to draw arrows.
Very simple customizable inline function to draw arrows. Lightweight and fast for drawing many, many arrows. You customize fill color, linewidth, etc... Tune theta up if you want a wider arrowhead
- 3K (depuis toujours)
- 1 (30 derniers jours)
- 4,0 / 5
- Communauté
-
4 mai 2010

- 1,3K (depuis toujours)
- 1 (30 derniers jours)
- 5,0 / 5
- Communauté
-
11 juil. 2013
- 1,8K (depuis toujours)
- 6 (30 derniers jours)
- 5,0 / 5
- Communauté
-
2 août 2020

- 182 (depuis toujours)
- 2 (30 derniers jours)
- 5,0 / 5
- Communauté
-
10 mars 2021

Wireless Charging Vehicle Routing and Velocity Prediction
Here We propose a model with both Routing and velocity assignment using Random Search Optimization Method.
- 308 (depuis toujours)
- 2 (30 derniers jours)
- 5,0 / 5
- Communauté
-
15 fév. 2020

Ogive optimization toolbox for deriving surface fluxes in challenging environments
- 2,4K (depuis toujours)
- 4 (30 derniers jours)
- 5,0 / 5
- Communauté
-
13 déc. 2023

Plot evenly spaced streamlines for a vector field in several styles
:+ "Fancy" arrow, taper, and texture styles as described Jobar & Lefer, 1997 [1]+ Explicit control over both minimum and maximum streamline spacing+ Better selection of streamline step size for high line
- 748 (depuis toujours)
- 3 (30 derniers jours)
- 5,0 / 5
- Communauté
-
5 oct. 2016

- 22,2K (depuis toujours)
- 11 (30 derniers jours)
- 4,7 / 5
- Communauté
-
21 nov. 2002

- 3,4K (depuis toujours)
- 3 (30 derniers jours)
- 5,0 / 5
- Communauté
-
3 déc. 2014

- 754 (depuis toujours)
- 7 (30 derniers jours)
- 5,0 / 5
- Communauté
-
2 oct. 2019
- 3,7K (depuis toujours)
- 2 (30 derniers jours)
- 5,0 / 5
- Communauté
-
9 avr. 2003

Unscented Hellinger distance between GMMs
The code calculates a metric between a pair of multivariate Gaussian Mixture Models.
- 1,7K (depuis toujours)
- 1 (30 derniers jours)
- 5,0 / 5
- Communauté
-
7 juin 2013

drawVector- draws 2D or 3D vectors from specified points
Draws 3 arrows representing the basis vectors of an R3 coordinate system
drawVector - draws 2D or 3D vectors from specified pointsdrawOrdinates - draws 3 arrows representing the basis vectors of an R3 coordinate system ----------------------------------drawVector - is a
- 623 (depuis toujours)
- 2 (30 derniers jours)
- 5,0 / 5
- Communauté
-
22 juin 2021

- 1,9K (depuis toujours)
- 4 (30 derniers jours)
- 4,7 / 5
- Communauté
-
9 oct. 2010
- 7,3K (depuis toujours)
- 8 (30 derniers jours)
- 4,5 / 5
- Communauté
-
30 août 2002
- 5,4K (depuis toujours)
- 29 (30 derniers jours)
- 4,7 / 5
- Communauté
-
25 août 2015
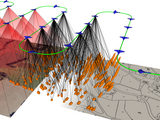
3D convertor from Matlab to SketchUp, permits to create visualization for debugging purposes, data analysis and results rendering.
- 294 (depuis toujours)
- 2 (30 derniers jours)
- 5,0 / 5
- Communauté
-
31 mai 2019
Plots the 2D Mohr circle following the conventions used in strength of materials theory
- 197 (depuis toujours)
- 4 (30 derniers jours)
- 5,0 / 5
- Communauté
-
23 août 2019

- 9,3K (depuis toujours)
- 50 (30 derniers jours)
- 5,0 / 5
- Communauté
-
22 oct. 2022

campo de direcciones para ecuaciones diferenciales de primer orden
algoritmo el cual muestra el campo de direcciones de una ecuación diferencial de primer ordenexisten 4 archivos solo correr el algoritmo campodir los demás son funciones como arrow3 y sym2str
- 141 (depuis toujours)
- 2 (30 derniers jours)
- 5,0 / 5
- Communauté
-
3 sept. 2020

- 606 (depuis toujours)
- 2 (30 derniers jours)
- 5,0 / 5
- Communauté
-
20 juin 2021

Easy annotation-type 2D Cartesian (x- and y-coordinates) text arrow.
Draws textarrow annotation to specified point (x,y) with specified relative length and rotation. Arrow position is refreshed with each zoom callback.All textarrow annotation properties can be
- 181 (depuis toujours)
- 1 (30 derniers jours)
- 5,0 / 5
- Communauté
-
26 juil. 2018

Creates a color quiver plot with arrows colors according to the magnitude of the vector.
This is a modified version of the function quiver [from C.M. Thompson] to plot velocity vectors as arrows with components (u,v) at the points (x,y) with the color corresponding to the magnitude of
- 14,2K (depuis toujours)
- 5 (30 derniers jours)
- 4,5 / 5
- Communauté
-
26 nov. 2008

structure tensor - introduction and tutorial
Comprehensive intro to structure tensors both in 2D and 3D
- 9,2K (depuis toujours)
- 3 (30 derniers jours)
- 5,0 / 5
- Communauté
-
1 nov. 2006

Several color conversion and graphic tools to play around with
special here, basically auxiliary functions to add textbook type of axis (arrows departing from origin), draw curved arrows, link rotations, etc.One function is worth mentioning,placefig(figNr,m,n,k) which
- 706 (depuis toujours)
- 2 (30 derniers jours)
- 5,0 / 5
- Communauté
-
30 déc. 2016

Spongebob Squarepants goes 3-D
GUI demonstration of different representations of 3-D rotations
: https://es.mathworks.com/matlabcentral/fileexchange/56758-rigid-motions-and-robotics-toolboxNote you need the toolbox installed and set up (see the setup__robotics_toolbox.m script therein) for this demo to work.You will also need Georg Stillfried's mArrow3.m function before you are able to run
- 248 (depuis toujours)
- 3 (30 derniers jours)
- 5,0 / 5
- Communauté
-
22 jan. 2018

- 11,8K (depuis toujours)
- 12 (30 derniers jours)
- 4,5 / 5
- Communauté
-
29 oct. 2012

Wireless Sensor Network Simulator GUI
Develop Simple and Efficient WSN Simulator for Researchers Version 1.0
- 1,6K (depuis toujours)
- 3 (30 derniers jours)
- 4,5 / 5
- Communauté
-
29 avr. 2020

This function SFBM.m calculates and draw the shear force and bending moment diagrams.
- 12,7K (depuis toujours)
- 51 (30 derniers jours)
- 4,8 / 5
- Communauté
-
19 sept. 2024

TIGRE: Tomographic Iterative GPU-based Reconstruction Toolbox
3D tomographic reconstruction software
- 3,6K (depuis toujours)
- 6 (30 derniers jours)
- 4,7 / 5
- Communauté
-
13 août 2024

Emitter Detection and Geolocation for Electronic Warfare
MATLAB code companion to Emitter Detection and Geolocation for Electronic Warfare (Artech House, 2019)
- 1,4K (depuis toujours)
- 8 (30 derniers jours)
- 4,8 / 5
- Communauté
-
21 mai 2023
Draws an annotation arrow with respect to the data coordinate system
The input arguments are the same as for the MATLAB inbuilt function annotation('arrow',...) but the position is defined in the data coordinate system.This function is just a little workaround to add
- 174 (depuis toujours)
- 3 (30 derniers jours)
- 4,7 / 5
- Communauté
-
19 jan. 2018
- 4,3K (depuis toujours)
- 4 (30 derniers jours)
- 5,0 / 5
- Communauté
-
23 oct. 2020

Plot Pressure Distribution (Cp) Over an Airfoil / Aerofoil ; Vector Plot ; Arrow Plot
Plot Cp Distribution Vector over airfoil or closed curve.
- 1,5K (depuis toujours)
- 6 (30 derniers jours)
- 4,0 / 5
- Communauté
-
5 oct. 2017
- 1,1K (depuis toujours)
- 2 (30 derniers jours)
- 4,7 / 5
- Communauté
-
31 jan. 2017

A function to draw 3D-arrows.
I saw a arrow function by Dr. Erik A. Johnson last night, this function is very useful. But it can only draw 2d arrows, whose heads are patches. So i wrote this functin is used to draw 3D-arrows. the
- 10,3K (depuis toujours)
- 3 (30 derniers jours)
- 4,5 / 5
- Communauté
-
15 déc. 2006

DTI Fiber Tractography (Streamline Tracking Technique)
Diffusion MRI, DTI, Fiber Tracking, Diffusion Tensor Calculation, Fiber Visualization
- 2,9K (depuis toujours)
- 4 (30 derniers jours)
- 4,8 / 5
- Communauté
-
11 oct. 2012

Draw arrow(s) from point A to B.
A simple plotting tool used for drawing arrows/vectors from point A to B.Both A & B can be either n-by-2 (2D) or n-by-3 (3D) matrices. For more usage example, please use the "help arrow3" command
- 15,8K (depuis toujours)
- 4 (30 derniers jours)
- 4,4 / 5
- Communauté
-
19 déc. 2003
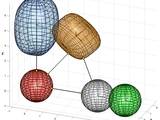
Minimum distance between two SuperEllipsoids.
Optimization method to determine the minimum distance (or max overlap) between two SuperEllipsoids?
- 1,5K (depuis toujours)
- 1 (30 derniers jours)
- 4,7 / 5
- Communauté
-
22 juil. 2020
- 4,3K (depuis toujours)
- 1 (30 derniers jours)
- 4,3 / 5
- Communauté
-
20 nov. 1998

Bifurcation analysis of dynamical systems. Integration of AUTO bifurcation software into MATLAB.
- 6,9K (depuis toujours)
- 5 (30 derniers jours)
- 4,9 / 5
- Communauté
-
13 juil. 2011