impulseplot
Plot impulse response of dynamic system
Syntax
Description
The impulseplot function plots the impulse response of a
dynamic system
model. To customize the plot,
you can return an ImpulsePlot object and modify it using dot notation. For
more information, see Customize Linear Analysis Plots at Command Line.
To obtain impulse response data or create an impulse plot with default plotting options,
use the impulse function.
impulseplot( plots the impulse response
of the dynamic system model sys)sys.
If sys is a multi-input, multi-output (MIMO) model, then the
impulseplot function creates a grid of plots with each plot displaying
the impulse response of one input-output pair.
If sys is a model with
complex coefficients, then the plot shows both the real and imaginary components of the
response on a single axes and indicates the imaginary component with a diamond marker. You
can also view the response using magnitude-phase and complex-plane plots. (since R2025a)
impulseplot(___, simulates the
response for the time steps specified by t)t. You can use
t with any of the input argument combinations in previous syntaxes.
To define the time steps, you can specify:
Final simulation time using a scalar value.
The initial and final simulation times using a two-element vector. (since R2023b)
All the time steps using a vector.
impulseplot(___,
specifies additional options for computing the step response, such as the step amplitude
(dU) or input offset (U). Use config)RespConfig to create config.
impulseplot(___,
plots the impulse response with the plotting options specified in
plotoptions)plotoptions. Settings you specify in
plotoptions override the plotting preferences for the current
MATLAB® session. This syntax is useful when you want to write a script to generate
multiple plots that look the same regardless of the local preferences.
impulseplot(___,
specifies response properties using one or more name-value arguments. For example,
Name=Value)impulseplot(sys,LineWidth=1) sets the plot line width to 1. (since R2026a)
When plotting responses for multiple systems, the specified name-value arguments apply to all responses.
The following name-value arguments override values specified in other input arguments.
TimeSpec— Overrides time values specified usingtConfig— Overrides options specified usingconfigParameter— Overrides parameter values specified usingpColor— Overrides colors specified usingLineSpecMarkerStyle— Overrides marker styles specified usingLineSpecLineStyle— Overrides line styles specified usingLineSpec
ip = impulseplot(___)
Examples
Generate a random state-space model with 5 states and create the impulse response plot with chart object ip.
rng("default")
sys = rss(5);
ip = impulseplot(sys);
Change the time units to minutes and turn on the grid.
ip.TimeUnit = "minutes";
grid on

The impulse plot automatically updates when you modify the chart object properties.
For this example, consider a MIMO state-space model with 3 inputs, 3 outputs and 3 states. Create an impulse plot with red colored grid lines.
Create the MIMO state-space model sys_mimo.
J = [8 -3 -3; -3 8 -3; -3 -3 8];
F = 0.2*eye(3);
A = -J\F;
B = inv(J);
C = eye(3);
D = 0;
sys_mimo = ss(A,B,C,D);
size(sys_mimo)
State-space model with 3 outputs, 3 inputs, and 3 states.
Create an impulse plot with chart object ip and display the grid.
ip = impulseplot(sys_mimo);
grid on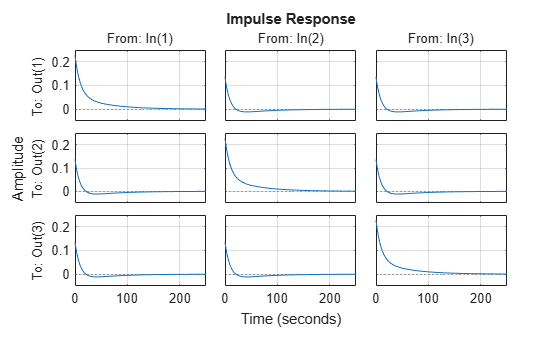
Set the grid color to red.
ip.AxesStyle.GridColor = [1 0 0];
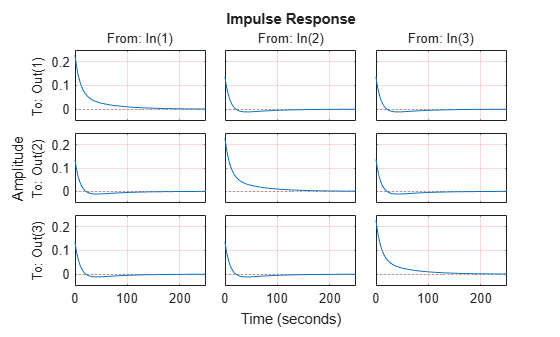
The impulse plot automatically updates when you modify the chart object. For MIMO models, impulseplot produces a grid of plots, each plot displaying the impulse response of one I/O pair.
Compare the impulse response of a parametric identified model to a nonparametric (empirical) model, and view their 3-σ confidence regions. (Identified models require System Identification Toolbox™ software.)
Identify a parametric and a nonparametric model from sample data.
load iddata1 z1
sys1 = ssest(z1,4);
sys2 = impulseest(z1);
Plot the impulse responses of both identified models. Use the plot handle to display the 3-σ confidence regions.
t = -1:0.1:5;
h = impulseplot(sys1,'r',sys2,'b',t);
showConfidence(h,3)
legend('parametric','nonparametric')

The nonparametric model sys2 shows higher uncertainty.
For this example, examine the impulse response of the following zero-pole-gain model and limit the impulse plot to tFinal = 15 s. Use 15-point blue text for the title.
sys = zpk(-1,[-0.2+3j,-0.2-3j],1)*tf([1 1],[1 0.05]);
tFinal = 15;
Create the impulse response plot and specify the title size and color.
ip = impulseplot(sys,tFinal);
ip.Title.FontSize = 15;
ip.Title.Color = [0 0 1];

Since R2025a
Create a state-space model with complex coefficients.
A = [-2-2i -2;1 0];
B = [2;0];
C = [0 0.5+2.5i];
D = 0;
sys = ss(A,B,C,D);
Plot the impulse response of the system.
ip = impulseplot(sys);
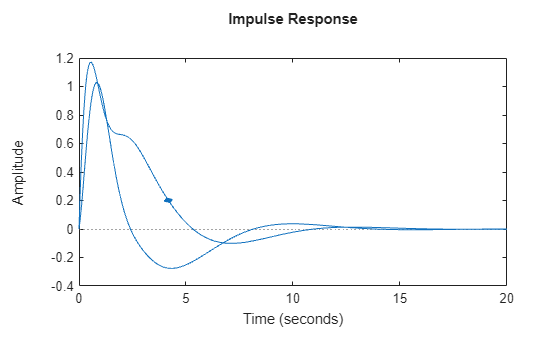
By default, the plot shows the real and imaginary components of the response on a single axes, indicating the imaginary component using a diamond marker.
You can also view the complex response using either a magnitude-phase plot or a complex-plane plot. For example, to view the magnitude and phase of the response, right-click the plot area and select Complex View >Magnitude-Phase.
ip.ComplexViewType = "magnitudephase";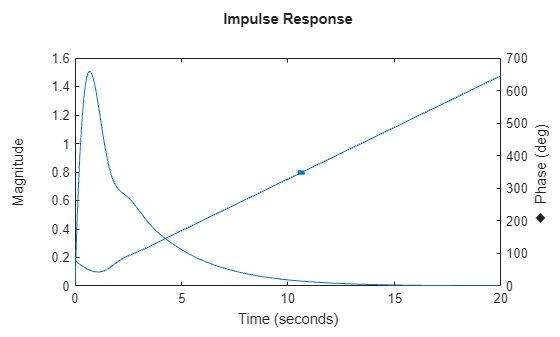
The plot shows the magnitude and phase of the response on a single axes, indicating the phase plot using a diamond marker.
You can view response characteristics in the plot. For example, to view the peak response, right-click the plot and select Characteristics > Peak Response.
Alternatively, you can enable the Visible property of the corresponding characteristic parameter of the chart object.
ip.Characteristics.PeakResponse.Visible = "on";
Input Arguments
Name-Value Arguments
Output Arguments
Version History
Introduced before R2006aSee Also
impulse | addResponse | showConfidence (System Identification Toolbox)