MIMO Frequency Response Data Models
This example shows how to create a MIMO frequency-response model using an frd object.
Frequency response data for a MIMO system includes a vector of complex response data for each of the input/output (I/O) pair of the system. Thus, if you measure the frequency response of each I/O pair of your system at a set of test frequencies, you can use the data to create a frequency response model.
For this example, load the frequency response data in AnalyzerDataMIMO.mat.
load AnalyzerDataMIMO H11 H12 H21 H22 freq
This command loads the data into the MATLAB® workspace as five column vectors H11, H12, H21, H22, and freq. The vector freq contains 100 test frequencies. The other four vectors contain the corresponding complex-valued frequency response of each I/O pair of a two-input, two-output system.
Organize the data into a three-dimensional array.
Hresp = zeros(2,2,length(freq));
Hresp(1,1,:) = H11;
Hresp(1,2,:) = H12;
Hresp(2,1,:) = H21;
Hresp(2,2,:) = H22;
The dimensions of Hresp are the number of outputs, number of inputs, and the number of frequencies for which there is response data. Hresp(i,j,:) contains the frequency response from input j to output i.
Create a frequency-response model.
H = frd(Hresp,freq);
H is an frd model object that represents frequency response data.
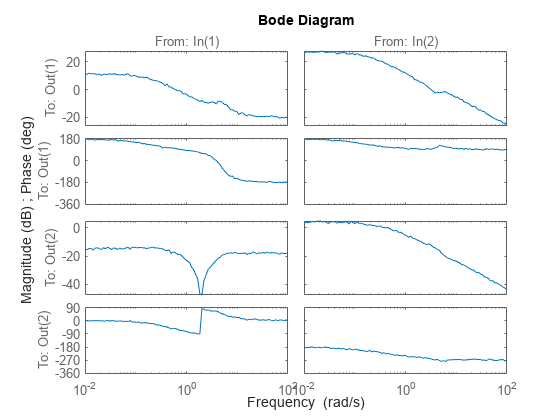
You can use frd models with many frequency-domain analysis commands. For example, visualize the response of this two-input, two-output system using bode.
bode(H)
By default, the frd command assumes that the frequencies are in radians/second. To specify different frequency units, use the TimeUnit and FrequencyUnit properties of the frd model object. For example, set the frequency units to radians/minute.
H = frd(Hresp,freq,"TimeUnit","min","FrequencyUnit","rad/TimeUnit");