Access Basemaps for Geographic Axes and Charts
MathWorks® offers a selection of basemaps for use with geographic axes and charts.
The basemaps provide a variety of map options, including two-tone, color terrain, and
high-zoom-level displays. Six of the basemaps are tiled data sets created using
Natural Earth. Five of the basemaps are high-zoom-level maps hosted by Esri®. For more information about basemap options, see geobasemap.
To specify a basemap for your geographic axes or chart, you can either:
Use the
geobasemapfunction.Set the
Basemapproperty of theGeographicAxesorGeographicBubbleChartobject.
You can also add a basemap picker to the axes toolbar by using the Mapping Toolbox™ function addToolbarMapButton (Mapping Toolbox).
MATLAB® includes one installed basemap, a two-tone map named
'darkwater'. Use of this basemap does not require internet
access. Use of the other basemaps, including the default basemap
'streets-light', does require internet access.
If you have trouble accessing basemaps over the internet, check your proxy server settings. For more information about specifying proxy server settings, see Use MATLAB Web Settings for Proxy Server Settings.
If you do not have reliable access to the internet, or want to improve map
responsiveness, you can plot using the 'darkwater' basemap or
download a selection of basemaps onto your local system.
Display "darkwater" on Geographic Plots
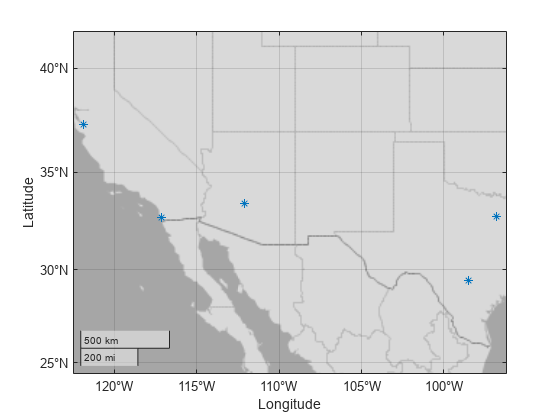
To display the "darkwater" basemap while plotting with functions such as geoplot and geoscatter, call geobasemap.
lat1 = [33.448 29.424 32.716 32.777 37.338];
lon1 = [-112.074 -98.494 -117.161 -96.797 -121.886];
geoscatter(lat1,lon1,"*")
geobasemap darkwater
Alternatively, you can create a set of geographic axes and specify the Basemap name-value pair.
figure
lat2 = [40.713 34.052 41.878 29.760 39.952];
lon2 = [-74.006 -118.244 -87.630 -95.370 -75.165];
geoaxes("Basemap","darkwater")
geoscatter(lat2,lon2,"*")

You can also change the default basemap for all plots created with geoplot, geoscatter, and geodensityplot during your MATLAB session.
set(groot,"defaultGeoaxesBasemap","darkwater")
Display "darkwater" on Geographic Bubble Charts
To display "darkwater" on a geographic bubble chart, call geobubble using the Basemap name-value argument.
tsunamis = readtable("tsunamis.xlsx");
geobubble(tsunamis,"Latitude","Longitude","Basemap","darkwater")

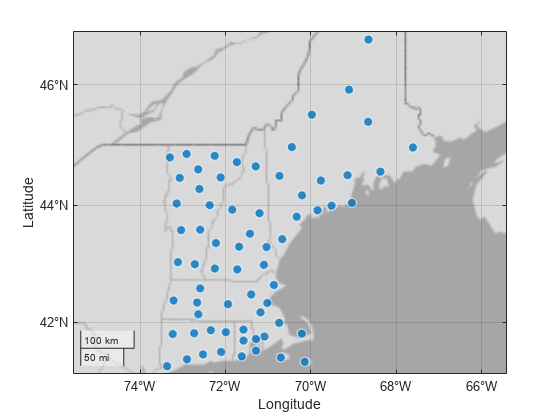
Alternatively, you can specify the basemap by using geobasemap.
counties = readtable("counties.xlsx");
geobubble(counties,"Latitude","Longitude")
geobasemap darkwater
Download Basemaps
Download basemaps onto your local system using the Add-On Explorer. The five high-zoom-level basemaps provided by Esri are not available for download.
On the MATLAB Home tab, in the Environment section, click Add-Ons and then Explore Add-Ons.
In the Add-On Explorer, scroll to the MathWorks Optional Features section, and click Show All to find the basemap packages. You can also search for the basemap add-ons by name (listed in the following table) or click Optional Features in Filter by Type.
Select the basemap add-ons that you want to download.
These are the names of the basemaps and their associated basemap Add-Ons.
| Basemap Name | Basemap Add-On |
|---|---|
"bluegreen" | MATLAB Basemap Data - bluegreen |
"grayland" | MATLAB Basemap Data - grayland |
"colorterrain" | MATLAB Basemap Data - colorterrain |
"grayterrain" | MATLAB Basemap Data - grayterrain |
"landcover" | MATLAB Basemap Data - landcover |
Basemap Caching Behavior
When you access a basemap over the internet, MATLAB improves performance by temporarily caching the basemap tiles. With this caching behavior, the program has to download each tile only once as you pan and zoom within the map. If you lose your connection to the internet, you can still view parts of the map that you have already viewed, because the map tiles are stored locally.
When you are not connected to the internet and you attempt to view a part of the
map that you have not previously viewed, tiles for these areas are not in your
cache. For the basemaps created using Natural Earth, the program replaces missing tiles with tiles from the
'darkwater' basemap.
For the high-zoom-level basemaps provided by Esri, the program caches a limited number of tiles and the cached tiles
expire after a limited time. If you attempt to view a region of a high-zoom-level
basemap that is not cached, you see blank map tiles. The geographic chart does not
use tiles from 'darkwater' for these missing tiles.
See Also
Functions
geobubble|geoaxes|geoplot|geobasemap|geoscatter
Properties
Topics
- Use Basemaps in Offline Environments (Mapping Toolbox)