show
Plot pose nodes, pose node edges, and landmark nodes of factor graph
Since R2024a
Description
show( plots the pose nodes and pose node
edges of the specified factor graph in a figure. Pose nodes are nodes of type
fg)"POSE_SE2" or "POSE_SE3".
show(
specifies options using one or more name-value arguments. For example,
fg,Name=Value)Landmark="off" plots the factor graph without displaying landmark
nodes.
ax = show(___)
Examples
Import a factor graph containing 2-D pose nodes.
fg = importFactorGraph("sineFactorGraph.g2o");Show the factor graph.
show(fg,Legend="on"); 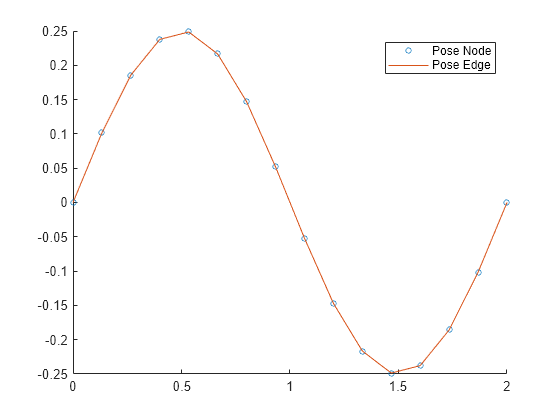
Input Arguments
Name-Value Arguments
Output Arguments
Tips
If you must update the figure frequently, set
Legendto"off"to improve the update rate.
Version History
Introduced in R2024a