show3D
Syntax
Description
[
visualizes latest states of the platforms and sensors in the robot scenario scene along with
all static meshes. The function also returns the axes on which the scene is plotted and the
frames on which each object is plotted.ax,plottedFrames] = show3D(scenario)
[
visualizes the robot scenario at the specified ax,plottedFrames] = show3D(scenario,time)time.
[
specifies additional options using name-value arguments.ax,plottedFrames] = show3D(___,Name=Value)
Examples
Create a robot scenario.
scenario = robotScenario(UpdateRate=100,StopTime=1);
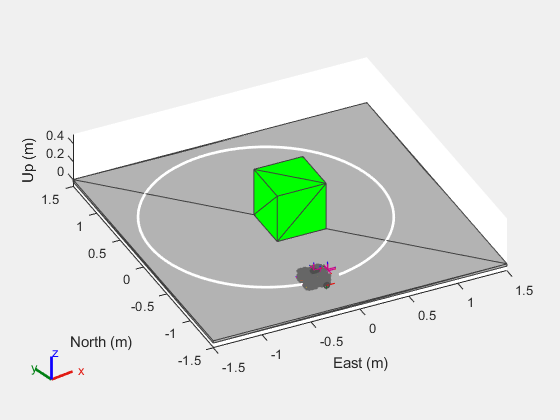
Add the ground plane and a box as meshes.
addMesh(scenario,"Plane",Size=[3 3],Color=[0.7 0.7 0.7]);
addMesh(scenario,"Box",Size=[0.5 0.5 0.5],Position=[0 0 0.25], ...
        Color=[0 1 0])
Create a waypoint trajectory for the robot platform using an ENU reference frame.
waypoint = [0 -1 0; 1 0 0; -1 1 0; 0 -1 0];
toa = linspace(0,1,length(waypoint));
traj = waypointTrajectory("Waypoints",waypoint, ...
                          "TimeOfArrival",toa, ...
                          "ReferenceFrame","ENU");
Create a rigidBodyTree object of the TurtleBot 3 Waffle Pi robot with loadrobot.
robotRBT = loadrobot("robotisTurtleBot3WafflePi");Create a robot platform with trajectory.
platform = robotPlatform("TurtleBot",scenario, ...
                         BaseTrajectory=traj);
Set up platform mesh with the rigidBodyTree object.
updateMesh(platform,"RigidBodyTree",Object=robotRBT)Create an INS sensor object and attach the sensor to the platform.
ins = robotSensor("INS",platform,insSensor("RollAccuracy",0), ...
                  UpdateRate=scenario.UpdateRate);
Visualize the scenario.
[ax,plotFrames] = show3D(scenario);
axis equal
hold on
In a loop, step through the trajectory to output the position, orientation, velocity, acceleration, and angular velocity.
count = 1;
while ~isDone(traj)
    [Position(count,:),Orientation(count,:),Velocity(count,:), ...
     Acceleration(count,:),AngularVelocity(count,:)] = traj();
    count = count+1;
end
Create a line plot for the trajectory. First create the plot with plot3, then manually modify the data source properties of the plot. This improves the performance of the plotting.
trajPlot = plot3(nan,nan,nan,"Color",[1 1 1],"LineWidth",2);
trajPlot.XDataSource = "Position(:,1)";
trajPlot.YDataSource = "Position(:,2)";
trajPlot.ZDataSource = "Position(:,3)";
Set up the simulation. Then, iterate through the positions and show the scene each time the INS sensor updates. Advance the scene, move the robot platform, and update the sensors.
setup(scenario)
for idx = 1:count-1
    % Read sensor readings.
    [isUpdated,insTimestamp(idx,1),sensorReadings(idx)] = read(ins);
    if isUpdated
        % Use fast update to move platform visualization frames.
        show3D(scenario,FastUpdate=true,Parent=ax);
        % Refresh all plot data and visualize.
        refreshdata
        drawnow limitrate
    end
    % Advance scenario simulation time.
    advance(scenario);
    % Update all sensors in the scene.
    updateSensors(scenario)
end
hold off
Input Arguments
Name-Value Arguments
Output Arguments
Version History
Introduced in R2022a