Save final operating point
Option to save complete model operating point when simulation is paused or stopped
Model Configuration Pane: Data Import/Export
Description
The Save final operating point parameter provides an option to save the complete model operating point instead of saving only final block states when the simulation is paused or stops. The complete model operating point includes the block states that are saved when you enable only the Final states parameter, as well as hidden block states, some block output values, and the state of the solver and execution engine.
Dependencies
To enable this parameter, select Final states.
Settings
off (default) | onoffIf you select Final states, the software saves only the final values for block states at the end of simulation. This information might not be sufficient to accurately and completely initialize a simulation to the same point.
onThe software saves complete information about the model operating point as a
Simulink.op.ModelOperatingPointobject when the simulation is paused or stops. The operating point information is stored in the Final states logging variable.
Examples
Open the model vdp.
mdl = "vdp";
open_system(mdl);
Configure the model to save the final operating point at the end of simulation.
On the Modeling tab, under Setup, click Model Settings.
In the Configuration Parameters dialog box, select the Data Import/Export pane.
On the Data Import/Export tab, select Final states and Save final operating point.
Click OK.
Alternatively, create a Simulink.SimulationInput object to store the parameter values for the simulation. Then, use the setModelParameter function to specify the parameter values to use in the simulation.
simIn = Simulink.SimulationInput(mdl);

simIn = setModelParameter(simIn,"SaveFinalState","on");
simIn = setModelParameter(simIn,"SaveOperatingPoint","on");
Set the stop time for the simulation to 10 seconds. On the Simulation tab, under Simulate, in the Stop Time box, enter 10, or use the setModelParameter function to specify the value of the StopTime parameter for the simulation.
simIn = setModelParameter(simIn,"StopTime","10");
Simulate the model.
out = sim(simIn);
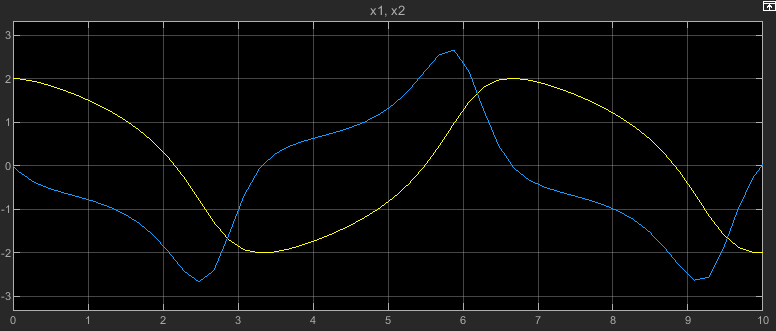
To view the simulation results, double-click the Scope block in the model. The plot in the Scope displays the values of the signals x1 and x2 over the 10-second simulation.
Resume the simulation by using the operating point you saved at the end of the first simulation as the initial operating point for the second simulation.
Get the final operating point from the first simulation from the Simulink.SimulationOutput object out.
vdpOP = out.xFinal;
Specify the operating point as the initial state for the simulation.
On the Modeling tab, under Setup, click Model Settings.
In the Configuration Parameters dialog box, on the Data Import/Export pane, select Initial state.
In the text box, enter
vdpOP.Click OK.
Alternatively, create another Simulink.SimulationInput object to configure this simulation. Then, use the setInitialState function to specify the initial state.
simIn2 = Simulink.SimulationInput(mdl);

simIn2 = setInitialState(simIn2,vdpOP);
Set the stop time for this simulation to 20. On the Simulation tab, under Simulate, in the Stop Time box, enter 20, or use the setModelParameter function to specify the value of the StopTime parameter for the simulation.
simIn2 = setModelParameter(simIn2,"StopTime","20");
Simulate the model again, resuming the prior simulation by starting this simulation from the final operating point saved in the first simulation.
out2 = sim(simIn2);
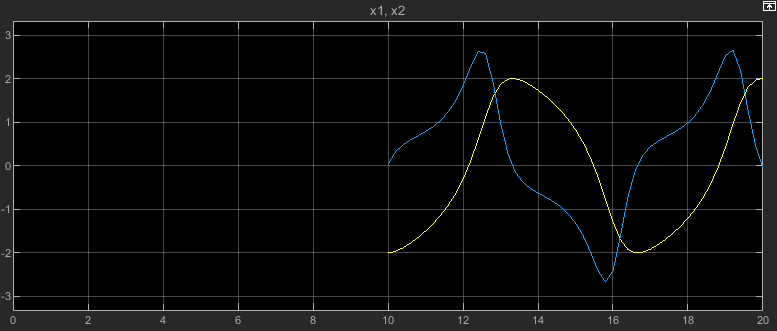
The plot in the Scope window updates to show the data from this simulation. The time axis starts at 0 and goes to the simulation stop time of 20. Because this simulation started from the initial operating point from the first simulation, which ended after 10 simulation seconds, the plot shows the values of the signals x1 and x2 only between simulation time 10 seconds and 20 seconds.
Programmatic Use
Parameter: SaveOperatingPoint |
| Type: string | character vector |
Value:
"on" | "off" |
Default:
"off" |