Explore Traceability Information Using Trace Views
When you develop software units and components, you create numerous artifacts like models, requirements, and tests. To understand the relationships between these artifacts and how those relationships impact your units and components, you can use the trace views in the Model Testing and Model Design Dashboards. A trace view is an interactive diagram that shows specific traceability information for artifacts in a project. Trace views provide a detailed, tree-like structure of the project artifacts and show relationships, individual artifact information, and a hierarchical view of the relationships between the artifacts in a project.
You can access trace views from the Model Testing Dashboard or Model Design Dashboard. The dashboards use traceability information to detect when changes to your project make the dashboard metric results outdated. You can use the default trace views to view:
Design dependencies
Requirement-to-design traceability
Tests and results
Units and components
To find the required files for a whole project or to find required products and add-ons, use the Dependency Analyzer. For more information, see Analyze Project Dependencies.
Access Trace Views
Open the project that you want to analyze. For this example, in the MATLAB® Command Window, enter:
openExample("slcheck/ExploreTestingMetricDataInModelTestingDashboardExample");
openProject("cc_CruiseControl");
Open the Dashboard window. On the Project tab, click either Model Testing Dashboard or Model Design Dashboard.
When you open either dashboard, the dashboard analyzes the project and collects information about the project artifacts, the artifact structure, and the traceability relationships between artifacts. The dashboard creates a digital thread that stores these attributes and unique identifiers for your project artifacts. The dashboard automatically populates the Project panel with the artifacts from the current project that are compatible with the currently selected dashboard.
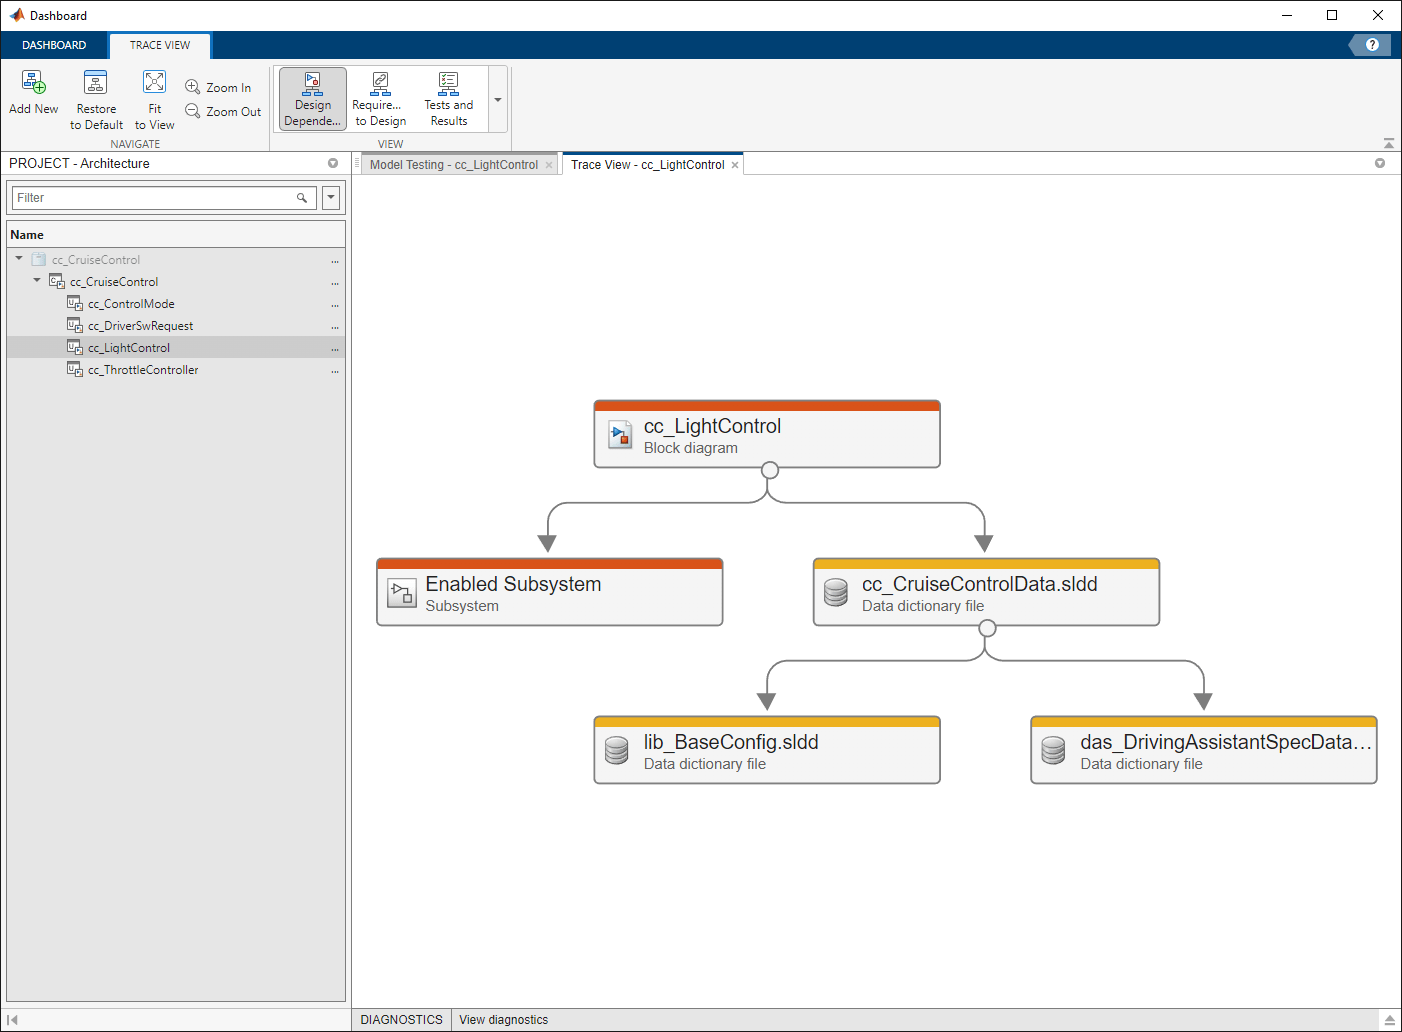
In the Project panel, select the artifact that you want to view a trace view for. For this example, select cc_LightControl.
When you select an artifact in the Project panel, the Artifacts panel shows the artifacts that the digital thread traces to that artifact. For more information on the artifact analysis and tracing that the dashboard performs, see Monitor Artifact Traceability and Detect Outdated Results with Digital Thread.
Open a trace view for the artifact by clicking the Traceability tab and clicking one of the trace view buttons in the Add Trace View section of the toolstrip. The Add Trace View section contains a trace view gallery where you can select different trace views for analyzing relationships between different types of artifacts in your project. For example, you can view the traceability relationships between the library blocks, data dictionaries, and other design artifacts for a model by clicking the Design Dependency button. If you click the Design Dependency button again, the dashboard opens a new trace view for the next available artifact listed in the Project panel.
To navigate and explore the trace view:
Zoom in or out by using the scroll wheel on your mouse or by using the Zoom In and Zoom Out buttons in the trace view toolbar.
Pan vertically and horizontally by holding the space bar and clicking and dragging the mouse. You can make the entire trace view diagram fit inside the current window by using Fit trace view to work area.
Search for a specific artifact name or file extension by using the Find button.
Highlight the connection between artifacts by clicking the arrow between the artifacts. You can click the arrow to select it. You can also move the artifacts and arrows in the trace view to rearrange the diagram.
Reset the diagram to the original layout and zoom level by clicking Reset trace view in the toolbar.
By default, trace views use straight lines to connect the artifacts. To allow the trace view to connect artifacts using lines with bends, select the Bent option in the Lines menu of the toolbar.
By default, trace views show artifacts in a hierarchy. But you can group artifacts that are closely related by using the Cluster option in the Layout menu of the toolbar. The Cluster option is helpful for visualizing large projects with complex hierarchies.
View information about an artifact by pointing to the artifact. The tooltip for the artifact shows detailed information and an Open Artifact button that you can use to open the artifact directly from the trace view.
When you select an artifact in the trace view, the Artifact Neighbors panel shows only the artifacts with direct traceability connections to that artifact. For example, if you have a test suite that contains many test cases and test results and you click a single test case, the Artifact Neighbors panel shows only the test suite and test results related to that specific test case. In the Artifact Neighbors panel, you can zoom by using the scroll wheel on your mouse or use the space bar to reset your view. When you click an artifact in the Artifact Neighbors panel, the current trace view automatically adjusts to highlight that artifact in the current trace view.
If you expect an artifact to appear in a trace view and it does not, see Resolve Missing Artifacts, Links, and Results.
Design Dependency Trace View
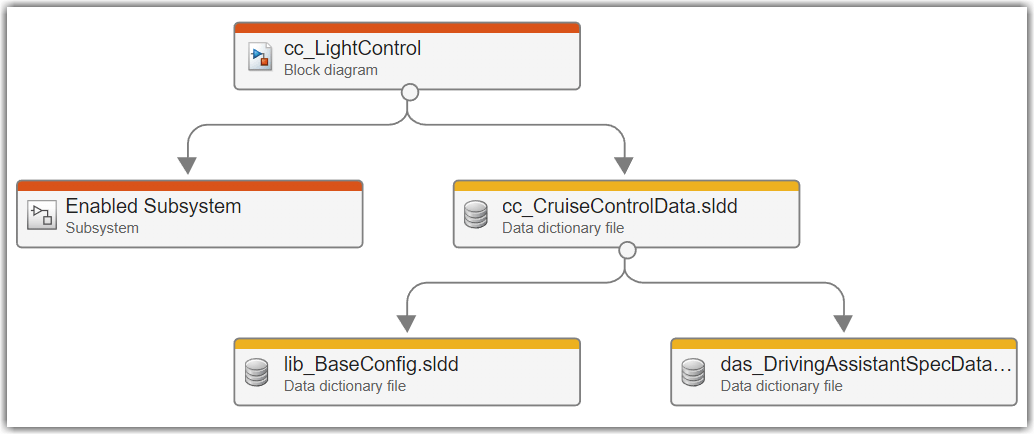
The Design Dependency trace view shows the library blocks, data dictionaries, model references, and MATLAB files that trace to the selected unit or component.
For example, the Design Dependency trace view for the example
software unit cc_LightControl shows that the unit:
Contains the subsystem
Enabled SubsystemRequires the three data dictionary files:
cc_CruiseControlData.sldd,lib_BaseConfig.sldd, anddas_DrivingAssistantSpecData.sldd
You can use the trace view to examine the relationships that the dashboard
identifies between design artifacts and to inspect component and unit dependencies.
If you point to lib_BaseConfig.sldd in the trace view, the
tooltip shows that this data dictionary file belongs to the referenced project
lib_CommonLib. To view the artifact relationship type, point
to the arrow between artifacts. For example, the unit
cc_LightControl requires the data dictionary file
cc_CruiseControlData.sldd and the unit
cc_LightControl contains the subsystem Enabled
Subsystem.
Requirement to Design Trace View
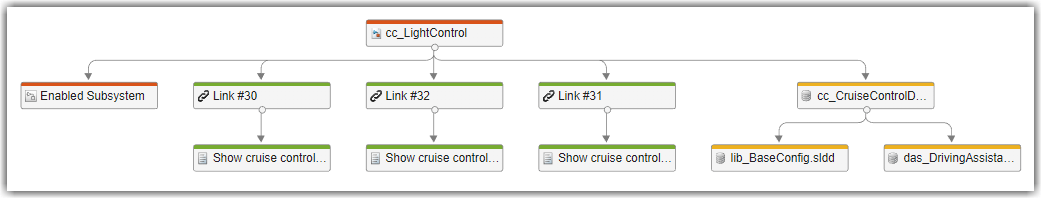
The Requirement to Design trace view shows the functional requirements that trace to the selected unit or component.
For example, the Requirement to Design trace view for the
example software component cc_LightControl shows that three
requirement links trace to three functional requirements: Show cruise
control light indicator, Show cruise control set indicator
light, and Show cruise control light when ignition switch is
turned. The trace view shows that the dashboard traced the
relationship from the block diagram for the unit, to the requirement link, and then
to the functional requirement.
When you point to a functional requirement, the tooltip shows where the requirement is in the requirements hierarchy and shows an Open Artifact button that you can use to open the requirement directly in the Requirements Editor.
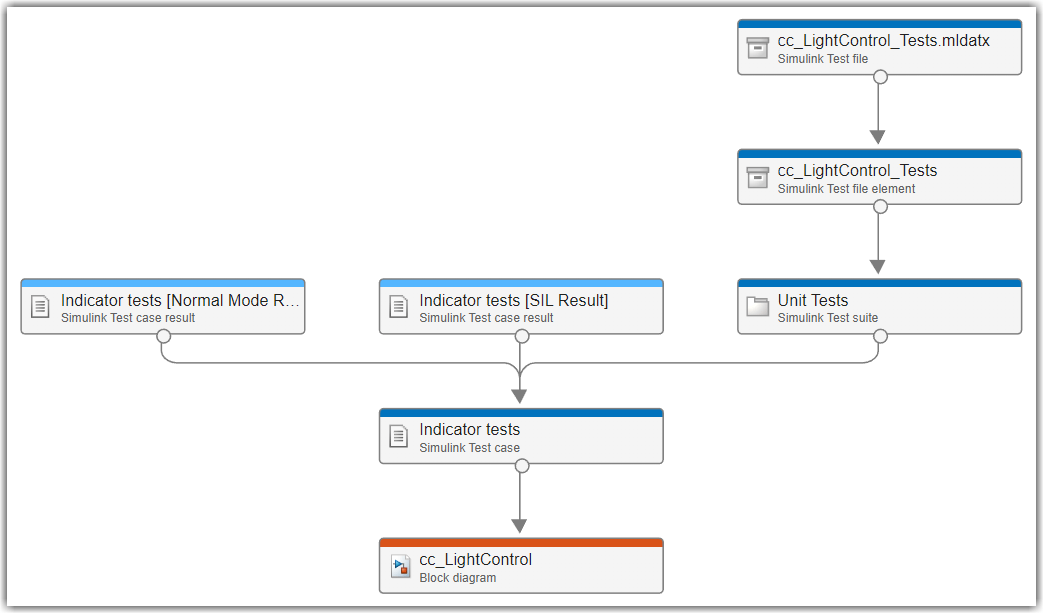
Tests and Results Trace View
The Tests and Results trace view shows the test cases and test results that trace to the selected unit or component. The trace view shows the Simulink® Test™ files and test suites that contain test cases that trace to the current unit or component. If you have test results associated with the test cases, the trace view traces those results to the test case and identifies whether the results are from model tests, software-in-the-loop (SIL) tests, or processor-in-the-loop (PIL) tests. The Tests and Results trace view can also show dependencies on external files like coverage filters, baseline files, parameter override sets, and configuration setting overrides.
When you point to a Simulink Test case result, you can open the result directly in Test Manager by clicking click Open Artifact in the tooltip.
Units and Components View
The Units and Components trace view shows the relationships between the units and components in your project. A unit is a functional entity in your software architecture that you can execute and test independently or as part of larger system tests. A component is an entity that integrates multiple testable units together. By default, the dashboard and trace view considers Simulink models as units and System Composer™ architecture models as components. However, to track the unit testing activities for your project, you can also reconfigure the dashboard to recognize the different testing levels of your models. You can specify which entities in your software architecture are units or higher-level components by labeling them in your project and configuring the dashboard to recognize the labels. For more information, see Categorize Models in Hierarchy as Components or Units.
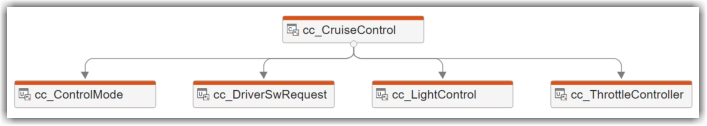
For example, the example project uses the project labels SW Verification
Unit and SW Verification Components to categorize
its Simulink models. The labels categorize the model
cc_CruiseControl as a component and the other models as
units. The Units and Components trace view for the example
project shows that the Simulink model cc_CruiseControl traces to the four models:
cc_ControlMode, cc_DriverSwRequest,
cc_LightControl, and
cc_ThrottleController.