Manage Project Artifacts for Analysis in Dashboard
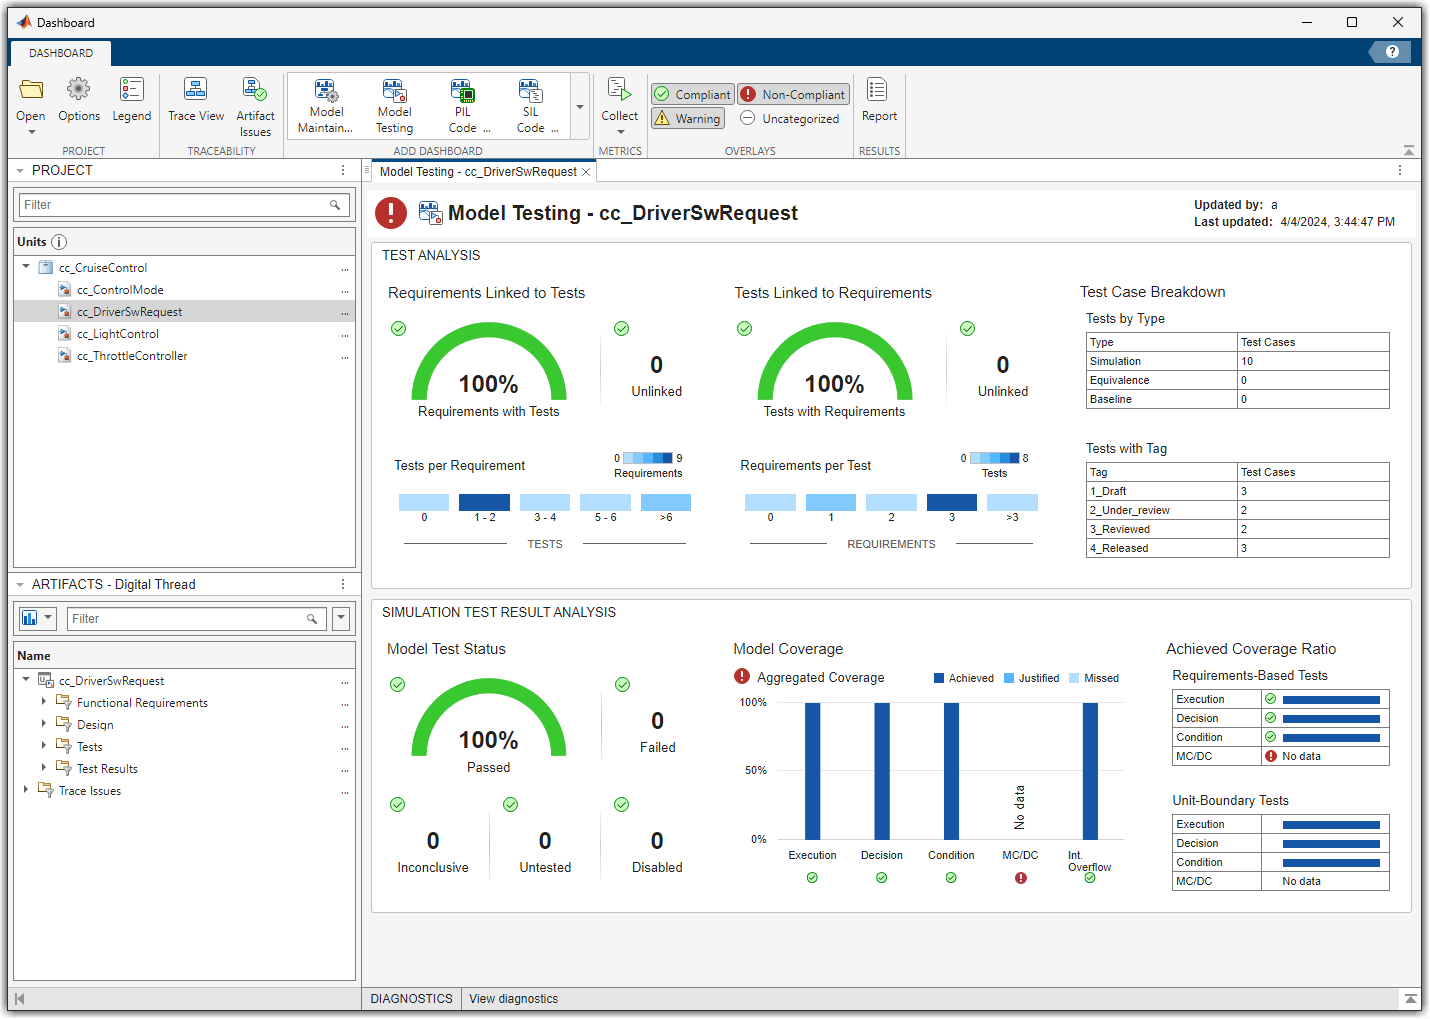
When you develop and test software units using Model-Based Design, use the dashboards to assess the status and quality of your unit testing activities. By establishing traceability links between your requirements, model design elements, and tests, you can measure the extent to which the requirements are implemented and verified. The dashboards analyze this traceability information and provides detailed metric measurements on the traceability, status, and results of these testing artifacts.
Each metric in the dashboard measures a different aspect of the quality of your models and reflects guidelines in industry-recognized software development standards, such as ISO 26262 and DO-178C. To monitor the quality of your models in the dashboards, maintain your artifacts in a project and follow these considerations.
Manage Artifact Files in Project
To analyze your activities in the dashboards, store your design and testing artifacts in a project. For information on how to get started with projects, see Create Project to Use Model Design and Model Testing Dashboards.
The types of artifacts that the metrics can analyze include:
Models
Libraries that the models use
Requirements that you create in Requirements Toolbox™
Tests that you create in Simulink® Test™
Test results from the executed tests
Note
Although the dashboard analyzes all artifacts inside the project folder, only artifacts directly related to a metric can cause the metric results to become outdated. For example, if you make a change to a test case, the dashboard can identify that the testing metric results are outdated. But if you make a change to the model that the test case tests, the dashboard is unable to identify if the testing metric results are now outdated from that change.
Specify Different Root Folders for Simulation Cache and Code Generation
By default, projects use the same root folder for both the simulation cache folder and the code generation folder. If possible, use different root folders for the simulation cache folder and code generation folder in your project. When you specify different root folders, the dashboard no longer needs to track changes to the simulation cache folder.
To view the cache folder settings for your project, on the Project tab, in the Environment section, click Settings. Then, in the Simulink section, see the Simulation cache folder and Code generation folder.
The behavior of change tracking only depends on the project settings. Custom
manipulations do not impact the change tracking behavior. For example, the dashboard
does not check root folders specified by
Simulink.fileGenControl.
Enable Artifact Tracing for Project
As you edit and save the artifacts in your project, the dashboard needs to track these changes to enable artifact tracing, track derived artifacts, and detect outdated metric results. By default, the dashboard requests that you enable artifact tracing the first time you open a project in the dashboard. Click Enable and Continue to allow the dashboard to track tool outputs to detect outdated metric results.
You can also manually enable artifact tracing by using the Digital Thread Settings dialog box. Open the Model Design or Model Testing Dashboard app and, in the dashboard toolstrip, click the Traceability tab and then click Settings. In the Digital Thread Settings dialog box, select Track tool outputs.
For information on how the dashboards are able to analyze artifacts and detect outdated metric results, see Monitor Artifact Traceability and Detect Outdated Results with Digital Thread.
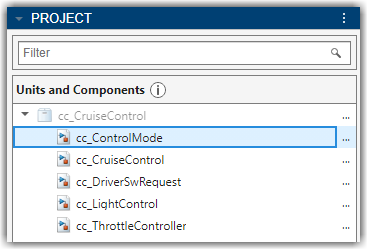
Trace Artifacts to Units and Components
The Project panel displays artifacts from the current project that are compatible with the currently selected dashboard. For example, you can open the Model Testing Dashboard for a unit in your project and you can open the Model Maintainability Dashboard for a unit or component in your project. You can specify which entities in your software architecture are units or higher-level components by labeling them in your project and configuring the dashboard to recognize the labels. By default, if you do not specify the models that are considered components, then the dashboard considers:
Simulink models as units.
System Composer™ architecture models as components.
For more information, see Categorize Models in Hierarchy as Components or Units.
To determine which artifacts are in the scope of a unit or component, the dashboard analyzes the traceability links between the artifacts, software unit models, and component models in the project. By default, the dashboard analyzes all files inside your project folder, even if the files are not on the path or not added to the project. If you want to exclude certain models from the dashboard, specify which models are units or components by labeling them in your project and configuring the dashboard to recognize the label, as shown in Specify Models as Components and Units.
To see the traceability path that the dashboard found between a unit or component and its artifacts, open a trace view by clicking the Traceability tab and selecting a trace view from the Add Trace View section of the toolstrip. Trace views are interactive diagrams that you can use to see how artifacts trace to units and components in your design and to view the traceability information for requirements, tests, and test results in the project. For more information, see Explore Traceability Information Using Trace Views.
When you select an artifact in the Project panel, the Artifacts panel shows the artifacts that trace to the selected artifact. For units and components, the traced artifacts include:
Functional requirements
Design artifacts
Tests
Test results

Functional Requirements
The folder Functional Requirements shows requirements of
Type
Functional that are either implemented by or upstream of the unit or
component.
When you collect metric results, the dashboard analyzes only the functional requirements that the unit or component directly implements. The folder Functional Requirements contains two subfolders to help identify which requirements are implemented by the unit or component, or are upstream of the unit or component:
Implemented — Functional requirements that are directly linked to the unit or component with a link Type of
Implements. The dashboard uses these requirements in the metrics for the unit or component.Upstream — Functional requirements that are indirectly or transitively linked to the implemented requirements. The dashboard does not use these requirements in the metrics for the unit or component.
Use the Requirements Toolbox to create or import the requirements in a requirements file
(.slreqx). If a requirement does not trace to a unit or
component, it appears in the Trace Issues folder. If a
requirement does not appear in the Artifacts panel when you expect
it to, see Resolve Missing Artifacts, Links, and Results.
For more information on how the dashboard traces dependencies between project files, see Monitor Artifact Traceability and Detect Outdated Results with Digital Thread.
Design Artifacts
The folder Design shows project artifacts that trace to the current unit or component, including:
The model file that contains the block diagram for the unit or component.
Models that the unit or component references.
Libraries that are partially or fully used by the model.
Data dictionaries that are linked to the model.
External MATLAB® code that traces to the model.
If an artifact does not appear in the Design folder when you expect it to, see Resolve Missing Artifacts, Links, and Results. For more information on how the dashboard traces dependencies between project files, see Monitor Artifact Traceability and Detect Outdated Results with Digital Thread.
Note
If you expect external MATLAB code to appear in the dashboard and it does not, check if the construct is not supported:
A class method does not appear in the Artifacts panel if the method is:
A nonstatic method that you call using dot notation.
A nonstatic method that you call using function notation.
A static method that you call from a Simulink model using dot notation.
A superclass method.
Defined in a separate file from the class definition file.
For these methods, the dashboard shows the associated class definition in the Design folder.
A class constructor does not appear in the Artifacts panel if the constructor is a superclass constructor. The dashboard shows the associated superclass definition in the Design folder, but not the method itself.
A class property does not appear in the Artifacts panel if the property is called from Simulink or Stateflow®. The dashboard shows the associated class definition in the Artifacts panel.
An enumeration class does not appear in the Artifacts panel. For example, if you use an Enumerated Constant block in Simulink, the dashboard does not show the MATLAB class that defines the
enumtype.If a class file contains a method and a local function that have the same name, calls that use dot notation call the method in the class definition, and calls that use function notation call the local function in the class file.
Tests
The folder Tests shows tests and test harnesses that trace to the selected unit. A test can be either a test iteration or a test case without iterations.
When you collect metric results for a unit, the dashboard analyzes only the unit tests. The folder Tests contains subfolders to help identify whether a test is considered a unit test and which test harnesses trace to the unit:
Unit Tests — Tests that the dashboard considers as unit tests. A unit test directly tests either the entire unit or lower-level elements in the unit, like subsystems. The dashboard uses these tests in the metrics for the unit.
Others — Tests that trace to the unit but that the dashboard does not consider as unit tests. For example, the dashboard does not consider tests on a library, subsystem reference, or virtual subsystem to be unit tests. The dashboard does not use these tests in the metrics for the unit.
Test Harnesses — Test harnesses that trace to the unit or lower-level elements in the unit. Double-click a test harness to open it.
Create tests by using Simulink Test. If a test does not trace to a unit, it appears in the Trace Issues folder. If a test does not appear in the Artifacts panel or you do not see metric results from a test when you expect to, see Resolve Missing Artifacts, Links, and Results.
For more information on how the dashboard traces dependencies between project files, see Monitor Artifact Traceability and Detect Outdated Results with Digital Thread.
Test Results
When you collect metric results for a unit, the dashboard analyzes only the test results from unit tests. The folder Test Results contains subfolders to help identify which test results are from unit tests.
The subfolders for Model, SIL, and PIL contain simulation results from normal, software-in-the-loop (SIL), and processor-in-the-loop (PIL) unit tests, respectively. The dashboard uses these results in the metrics for the unit.
The following types of test results are shown:
 Saved test results — results that
you have collected in the Test Manager and have exported to a
results file.
Saved test results — results that
you have collected in the Test Manager and have exported to a
results file. Temporary test results — results
that you have collected in the Test Manager but have not exported to
a results file. When you export the results from the Test Manager
the dashboard analyzes the saved results instead of the temporary
results. Additionally, the dashboard stops recognizing the temporary
results when you close the project or close the result set in the
Simulink Test Result Explorer. If you want to analyze the results in
a subsequent test session or project session, export the results to
a results file.
Temporary test results — results
that you have collected in the Test Manager but have not exported to
a results file. When you export the results from the Test Manager
the dashboard analyzes the saved results instead of the temporary
results. Additionally, the dashboard stops recognizing the temporary
results when you close the project or close the result set in the
Simulink Test Result Explorer. If you want to analyze the results in
a subsequent test session or project session, export the results to
a results file.
Others — Results that are not simulation results, are not from unit tests, are from disabled tests, or are only reports. The dashboard does not use these results in the metrics for the unit.
If a test result does not trace to a unit, it appears in the Trace Issues folder. If a test result does not appear in the Artifacts panel or you do not see metric results from a test when you expect to, see Resolve Missing Artifacts, Links, and Results.
If you use external MATLAB functions, see Control Inlining for External MATLAB Functions. The inlining of functions can produce inconsistent coverage metric results in the dashboard.
For more information on how the dashboard traces dependencies between project files, see Monitor Artifact Traceability and Detect Outdated Results with Digital Thread.
Note
Note that the model coverage metrics do not scope coverage to requirements. If you select the Scope coverage results to linked requirements check box in your test results, the dashboard ignores that selection and does not scope the model coverage metrics results that appear in the dashboard. For information on the Scope coverage results to linked requirements option, see Scoping Coverage for Requirements-Based Tests (Simulink Test).
Trace Issues
The folder Trace Issues shows artifacts that the dashboard has not traced to units or components. Use the folder Trace Issues to check if artifacts are missing traceability to the units or components. The folder Trace Issues contains subfolders to help identify the type of tracing issue:
Unexpected Implementation Links — Requirement links of Type
Implementsfor a requirement of TypeContaineror TypeInformational. The dashboard does not expect these links to be of TypeImplementsbecause container requirements and informational requirements do not contribute to the Implementation and Verification status of the requirement set that they are in. If a requirement is not meant to be implemented, you can change the link type. For example, you can change a requirement of TypeInformationalto have a link of TypeRelated to.Unresolved and Unsupported Links — Requirements links that are either broken in the project or not supported by the dashboard. For example, if a model block implements a requirement, but you delete the model block, the requirement link is now unresolved. The dashboard does not support traceability analysis for some artifacts and some links.
Untraced Tests — Tests that execute on models or lower-level elements, like subsystems, that are not on the project path.
Untraced Results — Results that the dashboard cannot trace to a test. For example, if a test produces a result, but you delete the test, the dashboard cannot trace the results to the test.
The dashboard does not support traceability analysis for some artifacts and some links. If an artifact is untraced when you expect it to trace to a unit or component, see the troubleshooting solutions in Resolve Missing Artifacts, Links, and Results.
Artifact Issues
To see details about artifacts that cause errors, warnings, and informational messages during analysis, click the Traceability tab and click Artifact Issues in the toolstrip. The issues persist between MATLAB sessions and you can sort the messages by their severity, message, source, or message ID.
The messages show:
Modeling constructs that the dashboard does not support
Links that the dashboard does not trace
Test harnesses or cases that the dashboard does not support
Test results missing coverage or simulation results
Artifacts that return errors when the dashboard loads them
Information about model callbacks that the dashboard deactivates
Artifacts that are not on the path and are not considered during tracing
For more information, see View Artifact Issues in Project.
Artifact Errors
The folder Errors appears if artifacts returned errors when the dashboard performed artifact analysis. These are some errors that artifacts might return during traceability analysis:
An artifact returns an error if it has unsaved changes when traceability analysis starts.
A test results file returns an error if it was saved in a previous version of Simulink.
To see details about the warnings and errors that the dashboard finds during artifact analysis, click the Traceability tab and click Artifact Issues in the toolstrip. Open these artifacts and fix the errors. The dashboard shows a banner at the top of the dashboard to indicate that the artifact traceability shown in the Project and Artifacts panels is outdated. Click the Trace Artifacts button on the banner to refresh the data in the Project and Artifacts panels.
Diagnostics
If you have errors or warnings during metric collection, the Diagnostics panel in the dashboard shows diagnostic messages that can help you identify and resolve these issues. You can filter the diagnostic messages by type, and you can clear the messages from the viewer.
If you expect an artifact to contribute to the metric results and it does not, make sure to check the Trace Issues folder in the Artifacts panel. The Trace Issues folder and subfolders show artifacts that the dashboard is unable to trace to the current artifact. Only artifacts that trace to the current artifact can contribute to the metric results in the dashboard. For more information on artifact traceability, see Resolve Missing Artifacts, Links, and Results.
Project Requires Analysis by the Dashboard
The first time that you open the dashboard for the project, the dashboard identifies the artifacts in the project and collects traceability information. The dashboard must perform this first-time setup to establish the traceability data before it can monitor the artifacts. If you cancel the first-time setup, the artifacts in the project appear in the Unanalyzed folder in the Artifacts panel. To trace the unanalyzed artifacts, click Collect > Trace Artifacts.
Control Inlining for External MATLAB Functions
By default, the coverage metrics include external MATLAB function coverage in the overall unit coverage.
If you have external MATLAB functions in your project, either:
Place the
coder.inline('never')directive inside the function and use a project label to categorize the M file as a unitPlace the
coder.inline('always')directive inside the function, but do not use a project label to categorize the M file as a unit
For information on the coder.inline directive, see coder.inline. If possible, avoid using
coder.inline('default'). The
coder.inline('default') directive uses internal heuristics to
determine whether to inline the function, which can produce inconsistent coverage
metric results in the dashboard.
Typically, you use a project label to categorize a model as a unit or component in the dashboard. When you add your unit label to an external MATLAB function, the function does not appear in the Project panel, but the dashboard is able to exclude the function coverage from the overall unit coverage. For information on how to use project labels to categorize units and components, see Categorize Models in Hierarchy as Components or Units.