Tune Control Design for VTOL UAV in Hover Configuration
This example shows how to tune your control system design for a VTOL aircraft in hover configuration.
VTOL aircraft must be tuned for each of the four configurations that it flies in, starting by the hover configuration. In the hover configuration, the aircraft tilts the front two rotors in order to achieve forward and backward motion.
This figure shows a VTOL aircraft in hover mode.
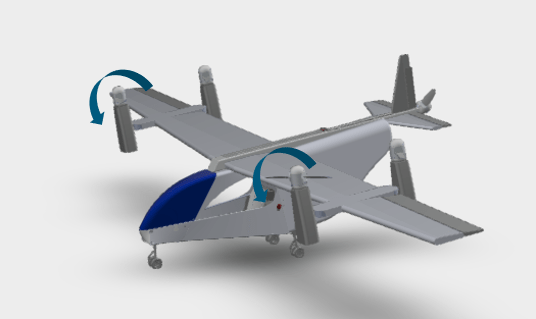
To achieve lateral motion in the hover configuration, the aircraft rolls similar to a multicopter. While in the hover configuration, the pitch is stabilized to 0 degrees to minimize interference of wing aerodynamic effects. The yaw is controlled through differential tilt of the front rotors.
Getting Started
To open the example livescript and directory which contains the Simulink project file, first run openExample('uav/TuneControlDesignForUAVInHoverExample') in the command window.
You must open the VTOLRefApp.prj project file to access the Simulink model, supporting files, and project shorcuts that this example uses.
% Open the Simulink project after running openExample('uav/TuneControlDesignForUAVInHoverExample')
prj = openProject("VTOLApp/VTOLRefApp.prj");
Use the highlighted project shortcuts for setting up the hover configuration. You can use the other project shortcuts for tuning the fixed-wing, transition configurations, and setting up the city mission. To see these shortcuts, you must open and view the Project Shotcuts tab.

To set up the aircraft plant model and base controller, click the Getting Started button in the project shortcuts or run the setupPlant helper function.
setupPlant;
Initialized VTOL model.
Enabled hover configuration.
Enabled hover guidance mission.
Set up Hover Configuration
To configure the UAV to hover configuration, click the Set Hover Configuration shortcut or run the setupHoverConfiguration helper function.
setupHoverConfiguration;
Enabled hover configuration.
Tune Control Design with Manual Control
To use manual control to tune the hover configuration, click Manual Mode under the Hover section in the project or use the setupHoverManual helper function directly.
setupHoverManual;
Enabled hover manual testbench mode.
Open and run the model
open_system(mdl);
Navigate to VTOLTiltrotor/Manual Control Dashboard. Adjust the sliders and observe the flight response of the UAV in hover configuration.
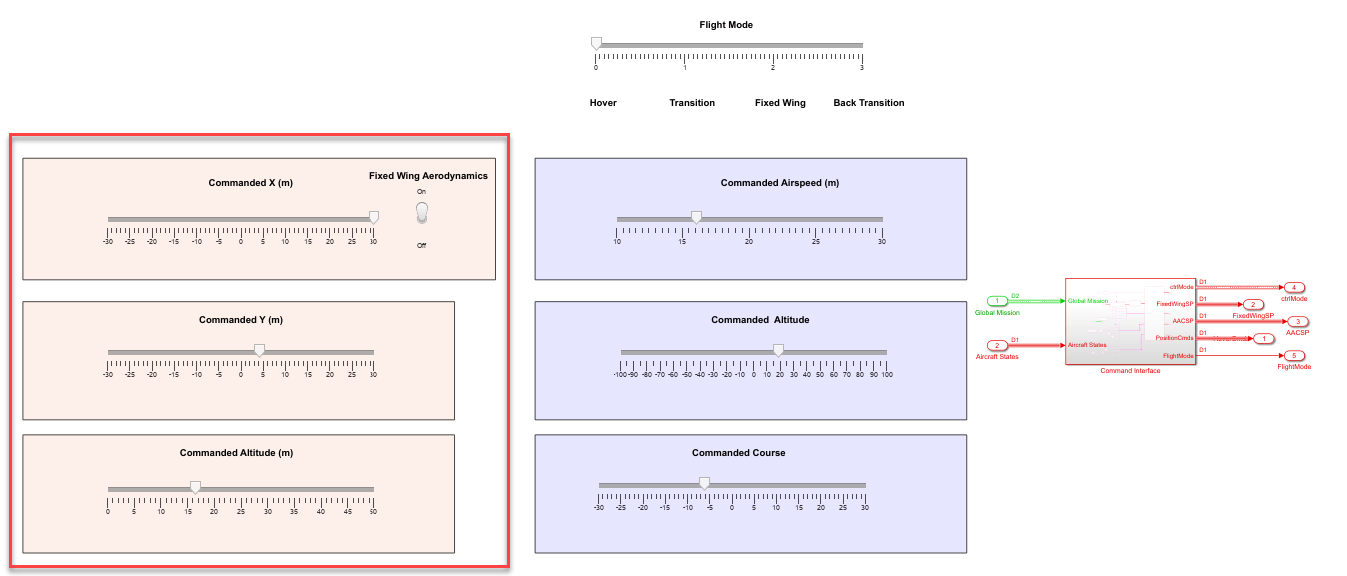
A set of predefined gains provided in exampleHelperInitializeVTOLGains.m are already loaded at setup. You can manually tune these gains for a more aggressive or robust control tracking.
Observe that the UAV follows the manual setpoint. However, this not sufficient to confirm the UAV's ability to follow all mission trajectories because it is possible for the UAV to enter a highly non-linear regimes when the mission's trajectory is complex.
In the next steps, leverage a test-bench to validate the UAV's ability to track complex trajectories.
Set up Guidance-Test Bench for Hover
The hover controller must be robust and be able to track trajectories precisely so that the VTOL UAV can navigate in dense urban scenarios. Instead of specifying setpoints manually, leverage guidance algorithms in UAV toolbox as a guidance-testbench to validate VTOL aircraft flying complex missions.
To set up a hover mission consisting of takeoff, waypoint navigation, and landing, click Guidance Mode shortcut or run the setupHoverGuidanceMission helper function.
setupHoverGuidanceMission;
Enabled hover guidance mission.
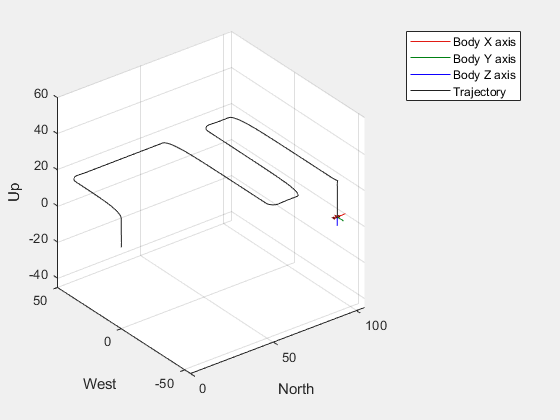
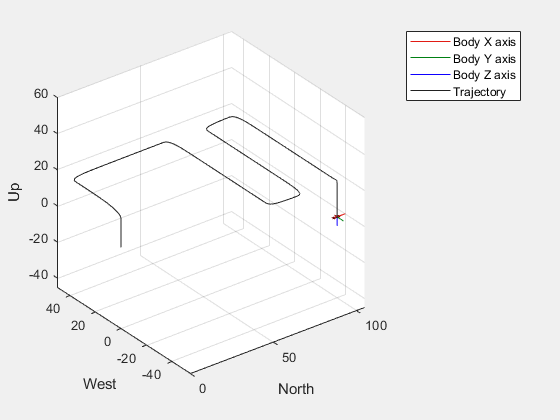
Run the Simulink model and store the output in outBaseline by running the sim function as follows. To visualize the trajectory, open the UAV Animation block inside the Visualization subsystem. The UAV takes off and flies in a zig-zag pattern before landing.
outBaseline = sim(mdl)
outBaseline =
  Simulink.SimulationOutput:

                  Alpha: [1x1 timeseries]
       FixedWingCmdFdbk: [1x1 struct]
        PositionCmdFdbk: [1x1 struct]
     TransitionFeedback: [1x1 struct]
                logsout: [1x1 Simulink.SimulationData.Dataset]
                   tout: [24794x1 double]

     SimulationMetadata: [1x1 Simulink.SimulationMetadata]
           ErrorMessage: [0x0 char]
Analyze Tracking and Control Performance.
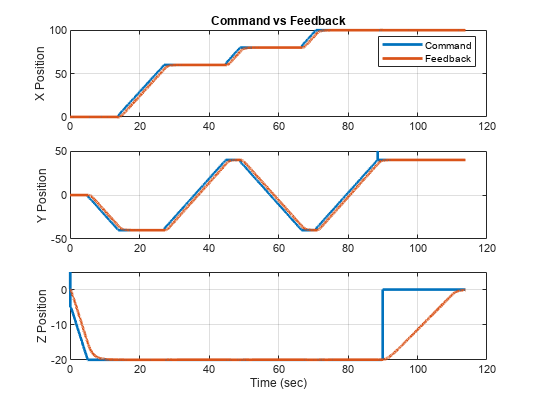
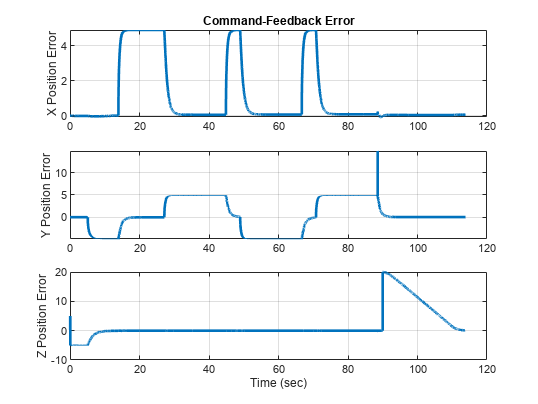
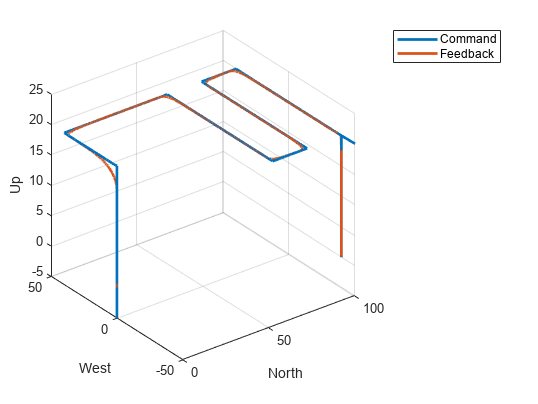
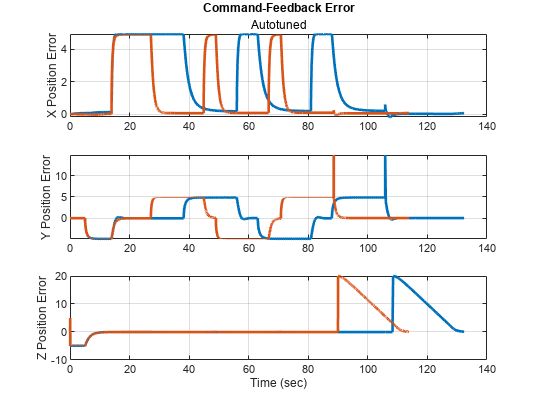
To plot the simulation output that you have stored in outBaseline, use the exampleHelperPlotHoverControlTrackingResults helper function. This allows you to visualize the control tracking error from the hover mission and determine the control design performance by comparing the command versus feedback position and errors.
The VTOL UAV is expected to reasonably follow the setpoints within some margin. However, lookahead distance of guidance logic also affects position error, which should be of the order of R_LOOKAHEAD, a control parameter set to 5.
%Plot results.
exampleHelperPlotHoverControlTrackingResults(outBaseline);

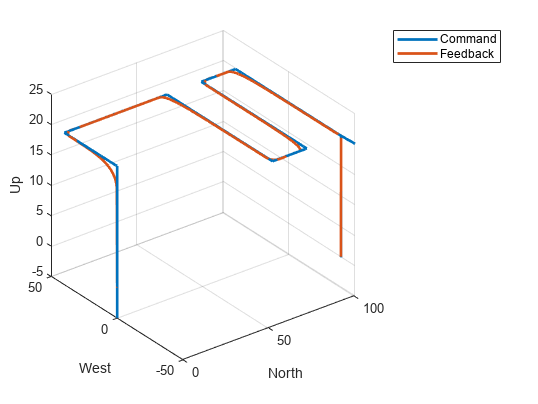
Note that while manual tracking was smooth, the VTOL UAV has a reduced performance while tracking a complex trajectory in hover. You can automate the process of control tuning to allow faster design iterations responding to changes in aircraft design.
In the next step, tune and test the controller in hover configuration.
Automate Tuning of Tiltrotor in Hover Configuration
You must enable the manual test bench mode and set the aircraft to manual control mode before starting the tuning process. Click Manual Mode under the Hover section in the project or use the setupHoverManual helper function
setupHoverManual;
Enabled hover manual testbench mode.
To automatically tune the VTOL UAV controller, you must linearize the aircraft around a trim configuration. Reset the multicopter commands to allow linearization at hover.
set_param([mdl '/Manual Control Dashboard/Slider1'],'Value','10');
set_param([mdl '/Manual Control Dashboard/Slider2'],'Value','0');
set_param([mdl '/Manual Control Dashboard/Slider3'],'Value','0');
In order to tune each controller loop, perform the following steps:
Obtain the linearization input and output points
Linearize the system using
linearizeObtain tuned controller using
pidtuneEnsure the tuned filter coefficient is nonzero
Write the tuned gains to the workspace
Run the exampleHelperAutomatedHoverControlTuning script to linearize and trim each controller in hover successively, from inner to outer loop, to achieve a phase margin of 60 degrees. This value is chosen to balance robustness and response time as a lower value of phase margin will lead to more oscillations with a faster response, and a higher value will lead to fewer oscillations with a slower response.
Note that the process of tuning the parameters can take some time. Fot this example, you can instead load the tuned parameters that is obtained from the tuning process by loading the tunedHoverGains_BW50 MAT file.
load tunedHoverGains_BW50;Verify Tracking and Control Performance
With the new gains, verify the improvement in controller performance by running the mission again. To set up the hover mission, click Guidance Mode shortcut or run the setupHoverGuidanceMission helper function
setupHoverGuidanceMission;
Enabled hover guidance mission.
Run the Simulink model and store the output in outTuned by running the sim function as follows. To visualize the trajectory, open the UAV Animation block inside the Visualization subsystem.
outTuned = sim(mdl);
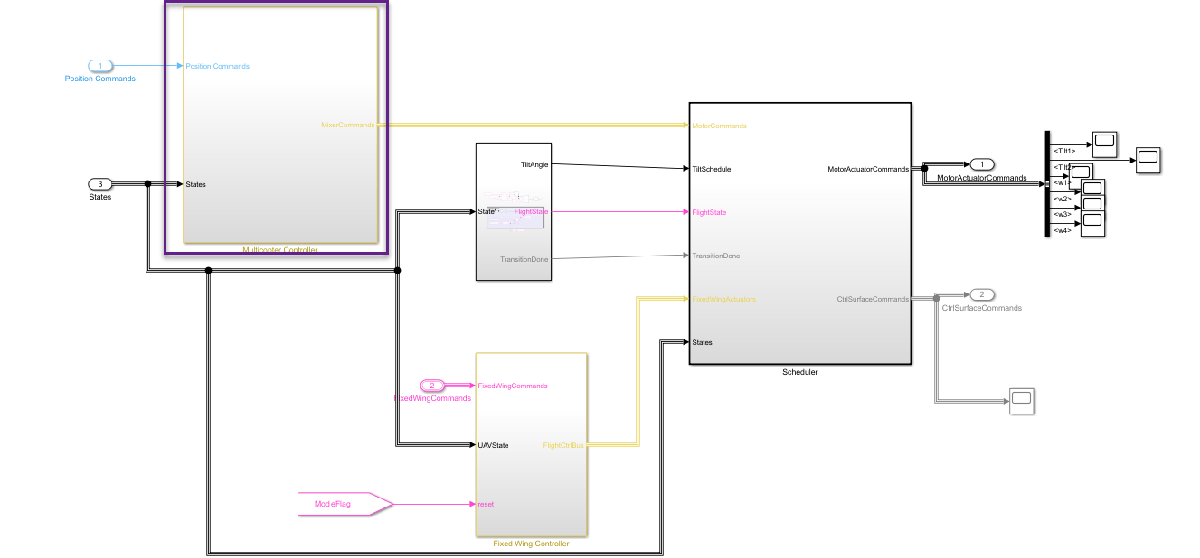
To plot the simulation ouput that you have stored in outTuned, use the exampleHelperPlotHoverControlTrackingResults helper function.
exampleHelperPlotHoverControlTrackingResults(outTuned);
Comparison of Mission Time Between Tuned and Untuned Gains
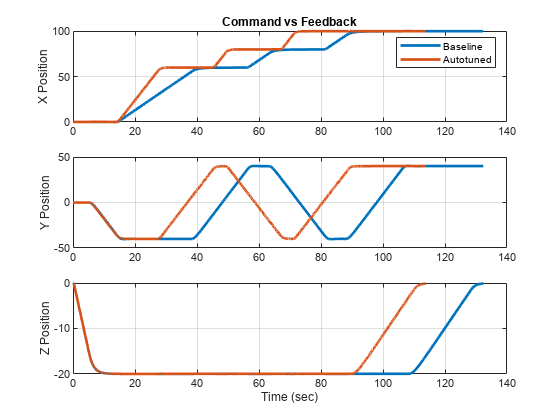
Use the exampleHelperPlotHoverControlTrackingComparison to plot and compare the baseline performance to the tuned performance. Note that the UAV performs mission about 20 seconds faster based on optimized gains while maintaining stability.
exampleHelperPlotHoverControlTrackingComparison(outBaseline,outTuned)
Before resuming to other examples in this example series, you must close the VTOLRefApp.prj Simulink project by running this command in the Command Window:
close(prj)
References
[1] N., Pavan. (2020). Design of Tiltrotor VTOL and Development of Simulink Environment for Flight Simulations.
[2] Mathur, Akshay & Atkins, Ella. (2021). Design, Modeling and Hybrid Control of a QuadPlane.
[3] Ducard, Guillaume Jacques Joseph and Minh-Duc Hua (2014). Modeling of an unmanned hybrid aerial vehicle.