Résultats pour
Have been using Thingspeak for a few years, suddenly I get this message relating to one of my Matlab analysis scripts, which has run for years:
Error Message:
Unrecognized function or variable 'cusum'. cusum requires Signal Processing Toolbox.
What has changed to cause this error - I've done nothing!
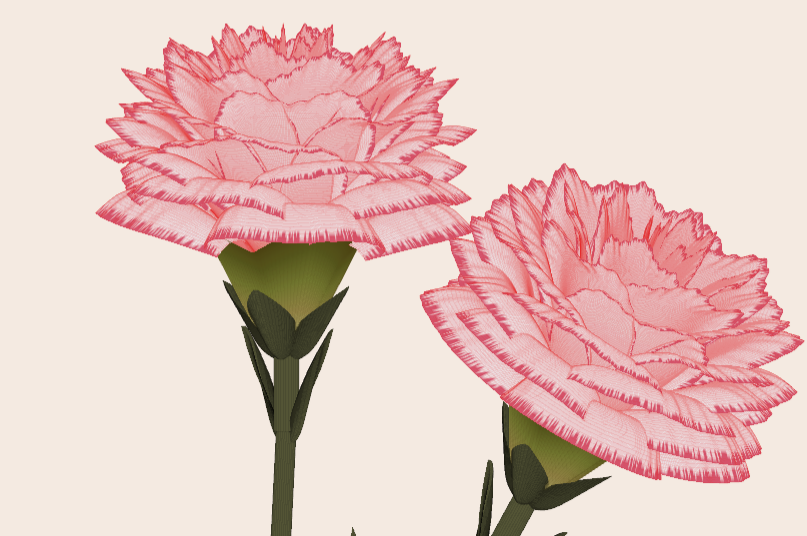
Generate a 3D visualization of carnation flowers
with sepals and stems for celebrating Mother's Day 2026.

function carnation
% CARNATION Generate a 3D visualization of carnation flowers with sepals and stems.
% This code is authored by Zhaoxu Liu / slandarer
% for the purpose of celebrating Mother's Day 2026.
% =========================================================================
% Zhaoxu Liu / slandarer (2026). carnation for Mother's Day
% (https://www.mathworks.com/matlabcentral/fileexchange/183838-carnation-for-mother-s-day),
% MATLAB Central File Exchange. Retrieved May 9, 2026.
% Create figure and axes / 创建图窗及坐标区域
fig = figure('Units','normalized', 'Position',[.3,.1,.4,.8],'Color',[244,234,225]./255);
axes('Parent',fig, 'NextPlot','add', 'DataAspectRatio',[1,1,1],...
'View',[-64, 5.5], 'Position',[0,-.15,1,1], 'Color',[244,234,225]./255, ...
'XColor','none', 'YColor','none', 'ZColor','none');
annotation("textbox", [.05, .8, .9, .2], "String", {"Happy"; "Mother's Day"}, ...
'FontName','Segoe Script', 'FontSize',52, 'FontWeight','bold', 'EdgeColor','none', ...
'HorizontalAlignment','center', 'VerticalAlignment','middle', 'Color',[97,40,20]./255);
xx = linspace(0, 1, 100);
tt = linspace(0, 1, 1e4);
[X, P] = meshgrid(xx, tt);
T1 = P*20*pi;
C1 = 1 - (1 - mod(3.6*T1/pi, 2)).^4./2; % Petal profile / 花瓣形状
S1 = (sin(50*T1)/150 + sin(10*T1)/30).*min(1, max(0, (X - .85)/.1)); % Edge serration / 边缘褶皱和锯齿
Y1 = (- (X.*1.2 - .5).^5.*32 - 1)./15.*P; % Petal curvature / 花瓣弧度
% Petal shape and serration modeling + rotating the planar petal to tilt it
% 花瓣形状和锯齿塑造 + 转动平躺的花瓣令其倾斜
R1 = (C1 + S1).*(X.*sin(P) - Y1.*cos(P))./(P + .5);
H1 = (C1 + S1).*(X.*cos(P) + Y1.*sin(P));
% Convert radius to Cartesian coordinates / 将半径映射为X,Y坐标
X1 = R1.*cos(T1);
Y1 = R1.*sin(T1);
% Colormap for carnation petals / 康乃馨配色
CList1 = [208, 62, 23; 221,146,121; 229,201,202; 233,219,222; 237,223,225]./255;
CMat1 = zeros(1e4, 100, 3);
CMat1(:, :, 1) = repmat(interp1(linspace(0, 1, size(CList1, 1)), CList1(:, 1), linspace(0, 1, 100)), [1e4, 1]);
CMat1(:, :, 2) = repmat(interp1(linspace(0, 1, size(CList1, 1)), CList1(:, 2), linspace(0, 1, 100)), [1e4, 1]);
CMat1(:, :, 3) = repmat(interp1(linspace(0, 1, size(CList1, 1)), CList1(:, 3), linspace(0, 1, 100)), [1e4, 1]);
% Darken edges / 边缘的深色
for i = 1:1e4
tNum = randi([98, 100]);
CMat1(i, tNum:end, 1) = 212./255;
CMat1(i, tNum:end, 2) = 87./255;
CMat1(i, tNum:end, 3) = 113./255;
end
% Rotation matrices / 旋转矩阵
Rx = @(rx) [1, 0, 0; 0, cos(rx), -sin(rx); 0, sin(rx), cos(rx)];
Rz = @(yz) [cos(yz), - sin(yz), 0; sin(yz), cos(yz), 0; 0, 0, 1];
Rx1 = Rx(pi/6); Rz1 = Rz(0);
% Render flower / 绘制康乃馨
surface(X1, Y1, H1 + .3, 'CData',CMat1, 'EdgeAlpha',0.1, 'EdgeColor',[224,39,39]./255, 'FaceColor','interp')
[U1, V1, W1] = matRotate(X1, Y1, H1 + .3, Rx1);
surface(U1 + .7, V1 - .7, W1 - .6, 'CData',CMat1, 'EdgeAlpha',0.1, 'EdgeColor',[224,39,39]./255, 'FaceColor','interp')
% Following the same method as before,
% the profile is designed with four serrated cycles to simulate the four sepals.
% 还是之前的方法,不过让轮廓有4个锯齿状周期来模拟四片花萼
% Sepals generation with 4-lobed pattern / 生成四片花萼(带4个锯齿状周期)
[X, T] = meshgrid(linspace(0, 1, 100), linspace(0, 1, 100).*2*pi);
P2 = T.*0 + pi/8;
C2 = .5 + (.5 - abs(mod(T, pi/2)/pi*2 - .5))*.4;
Y2 = (- (X.*1 - .5).^7.*128 - 1)./15 - .1;
R2 = C2.*(X.*sin(P2) - Y2.*cos(P2));
H2 = C2.*(X.*cos(P2) + Y2.*sin(P2));
X2 = R2.*cos(T);
Y2 = R2.*sin(T);
% Rotate by 90 degrees around the z-axis
% and reduce the size to render the four smaller sepals.
% 绕z轴旋转90度且减小其大小,绘制四片小花萼
% Smaller sepal layer / 绘制四片小花萼(第二层)
P3 = T.*0 + pi/10;
C3 = .3 + (.5 - abs(mod(T + pi/4, pi/2)/pi*2 - .5))*.7;
Y3 = (- (X.*.7 - .5).^7.*128 - 1)./15 - .1;
R3 = C3.*(X.*sin(P3) - Y3.*cos(P3));
H3 = C3.*(X.*cos(P3) + Y3.*sin(P3));
X3 = R3.*cos(T);
Y3 = R3.*sin(T);
% Colormap for sepals / 花托配色
CList2 = [178,173,113; 151,135, 73; 117,123, 50; 86, 89, 29; 75, 65, 17]./255;
CMat2 = zeros(100, 100, 3);
CMat2(:, :, 1) = repmat(interp1(linspace(0, 1, size(CList2, 1)), CList2(:, 1), linspace(0, 1, 100)), [100, 1]);
CMat2(:, :, 2) = repmat(interp1(linspace(0, 1, size(CList2, 1)), CList2(:, 2), linspace(0, 1, 100)), [100, 1]);
CMat2(:, :, 3) = repmat(interp1(linspace(0, 1, size(CList2, 1)), CList2(:, 3), linspace(0, 1, 100)), [100, 1]);
% Render sepals / 绘制花托
surf(X2, Y2, H2.*.8 + .12, 'CData',CMat2, 'EdgeAlpha',0.1, 'EdgeColor',CList2(end,:), 'FaceColor','interp')
surf(X3.*.93, Y3.*.92, H3.*.5 + .02, 'FaceColor',[ 84, 85, 54]./255, 'EdgeAlpha',0.1, 'EdgeColor','k')
[U2, V2, W2] = matRotate(X2, Y2, H2.*.8 + .12, Rx1);
[U3, V3, W3] = matRotate(X3.*.93, Y3.*.92, H3.*.5 + .02, Rx1);
surf(U2 + .7, V2 - .7, W2 - .6, 'CData',CMat2, 'EdgeAlpha',0.1, 'EdgeColor',CList2(end,:), 'FaceColor','interp')
surf(U3 + .7, V3 - .7, W3 - .6, 'FaceColor',[ 84, 85, 54]./255, 'EdgeAlpha',0.1, 'EdgeColor','k')
% A pulse function with two periods is applied
% to the contour to simulate the leaves.
% 让轮廓有2个周期且是脉冲函数,来模拟叶片
P4 = T.*0 + pi/16;
C4 = - abs(mod(T, pi)/pi - .5) + .11;
C4(C4 < 0) = 0; C4 = C4.*10; C4(51:100, :) = C4(51:100, :).*.7;
Y4 = (- (X.*1.01 - .5).^7.*128 - 1)./15 - .03;
R4 = C4.*(X.*sin(P4) - Y4.*cos(P4));
H4 = C4.*(X.*cos(P4) + Y4.*sin(P4));
X4 = R4.*cos(T);
Y4 = R4.*sin(T);
surf(X4 - .1, Y4 + .05, H4 - 2.2, 'FaceColor',[ 84, 85, 54]./255, 'EdgeAlpha',0.1, 'EdgeColor','k')
[U4, V4, W4] = matRotate(X4 - .1, Y4 - .1, H4 + .1, Rz1);
[U4, V4, W4] = matRotate(U4, V4, W4, Rx1);
surf(U4 + .7, V4 - .7 + 1, W4 - .6 - 1.2, 'FaceColor',[ 84, 85, 54]./255, 'EdgeAlpha',0.1, 'EdgeColor','k')
P5 = T.*0 + pi/8;
C5 = - abs(mod(T + pi/6, pi)/pi - .5) + .11;
C5(C5 < 0) = 0; C5 = C5.*5;
Y5 = (- (X.*1.01 - .5).^7.*128 - 1)./15 - .1;
R5 = C5.*(X.*sin(P5) - Y5.*cos(P5));
H5 = C5.*(X.*cos(P5) + Y5.*sin(P5));
X5 = R5.*cos(T);
Y5 = R5.*sin(T);
surf(X5, Y5, H5 - .3, 'FaceColor',[ 84, 85, 54]./255, 'EdgeAlpha',0.1, 'EdgeColor','k')
[U5, V5, W5] = matRotate(X5, Y5, H5+.1, Rx1);
surf(U5 + .7, V5 - .7 + 1/4, W5 - .6 - 1.7/4, 'FaceColor',[ 84, 85, 54]./255, 'EdgeAlpha',0.1, 'EdgeColor','k')
% Render stems / 绘制花杆
P1_1 = [mean(X3(:).*.93), mean(Y3(:).*.92), mean(H3(:).*.5 + .02)];
P1_2 = [mean(X5(:)), mean(Y5(:)), mean(H5(:) - .3)];
P1_3 = [mean(X4(:) - .1), mean(Y4(:) + .05), mean(H4(:) - 2.2)];
P1_3 = (P1_3 - P1_2).*1.4 + P1_2;
[XX1, YY1, ZZ1] = cylinderXYZ(P1_1, P1_2, .05);
[XX2, YY2, ZZ2] = cylinderXYZ(P1_2, P1_3, .04);
surf(XX1, YY1, ZZ1, 'FaceColor',[ 84, 85, 54]./255, 'EdgeAlpha',0.1, 'EdgeColor','k')
surf(XX2, YY2, ZZ2, 'FaceColor',[ 84, 85, 54]./255, 'EdgeAlpha',0.1, 'EdgeColor','k')
P1_1 = [mean(U3(:) + .7), mean(V3(:) - .7), mean(W3(:) - .6)];
P1_2 = [mean(U5(:) + .7), mean(V5(:) - .7 + 1/4), mean(W5(:) - .6 - 1.7/4)];
P1_3 = [mean(U4(:) + .7), mean(V4(:) - .7 + 1), mean(W4(:) - .6 - 1.2)];
P1_3 = (P1_3 - P1_2).*2.4 + P1_2;
[XX1, YY1, ZZ1] = cylinderXYZ(P1_1, P1_2, .05);
[XX2, YY2, ZZ2] = cylinderXYZ(P1_2, P1_3, .04);
surf(XX1, YY1, ZZ1, 'FaceColor',[ 84, 85, 54]./255, 'EdgeAlpha',0.1, 'EdgeColor','k')
surf(XX2, YY2, ZZ2, 'FaceColor',[ 84, 85, 54]./255, 'EdgeAlpha',0.1, 'EdgeColor','k')
% 在任意两点间构建圆柱
function [XX, YY, ZZ] = cylinderXYZ(P1, P2, r)
% CYLINDERXYZ Create a cylinder connecting two 3D points
% [XX, YY, ZZ] = cylinderXYZ(P1, P2, r) generates a cylinder
% of radius r between points P1 and P2.
v = P2 - P1; l = norm(v);
if l < eps, return; end
[XX, YY, ZZ] = cylinder(r, 30); ZZ = ZZ * l;
ddir = [0, 0, 1]; tdir = v / l;
if dot(ddir, tdir) > 0.9999
R = eye(3);
elseif dot(ddir, tdir) < -0.9999
R = [1, 0, 0; 0, -1, 0; 0, 0, -1];
else
av = cross(ddir, tdir); av = av / norm(av);
R = axisRotate(av, acos(dot(ddir, tdir)));
end
for ii = 1:size(XX, 1)
for jj = 1:size(XX, 2)
p = R * [XX(ii, jj); YY(ii, jj); ZZ(ii, jj)];
XX(ii, jj) = p(1) + P1(1);
YY(ii, jj) = p(2) + P1(2);
ZZ(ii, jj) = p(3) + P1(3);
end
end
end
% 通过矩阵旋转数据
function [U, V, W] = matRotate(X, Y, Z, R)
% MATROTATE Apply 3x3 rotation matrix to a set of 3D points
% [U,V,W] = matRotate(X,Y,Z,R) rotates points (X,Y,Z)
% using rotation matrix R.
U = X; V = Y; W = Z;
for ii = 1:numel(X)
v = [X(ii); Y(ii); Z(ii)];
n = R*v; U(ii) = n(1); V(ii) = n(2); W(ii) = n(3);
end
end
% 根据轴-角参数生成旋转矩阵
function R = axisRotate(axis, angle)
% AXISROTATE Compute rotation matrix from axis-angle representation
% R = axisRotate(axis, angle) returns a 3x3 rotation matrix
% for rotating by angle (radians) around the given axis vector.
% Implementation based on Rodrigues' rotation formula.
u = axis(1); v = axis(2); w = axis(3);
c = cos(angle); s = sin(angle);
R = [u^2 + (1-u^2)*c, u*v*(1-c) - w*s, u*w*(1-c) + v*s;
u*v*(1-c) + w*s, v^2 + (1-v^2)*c, v*w*(1-c) - u*s;
u*w*(1-c) - v*s, v*w*(1-c) + u*s, w^2 + (1-w^2)*c];
end
end
Hi,
I am trying to use an esp32 board with quectal ec200u LTE Modem to send sensor data to thingspeak. The board can process the sensor data however I am unable to send the data to thingspeak. I have used the same process earlier too however with a different modem from Simcom.
Can someone help me with specific commands for achieving this? I can share the code which i am trying to use.
Regards
Aditya
Good morning everyone. I’m having a problem with ThingSpeak. I’m sending data from an ESP LoRa with the RTC set to the Brasília time zone (GMT-3).
Previously, when I exported the data to CSV, it used the ThingSpeak time, which appeared 3 hours ahead. Now that I’m sending the timestamp from the ESP, the graphs are showing the data 3 hours behind. Is there a way to align the graph times while keeping the Brazilian time zone?
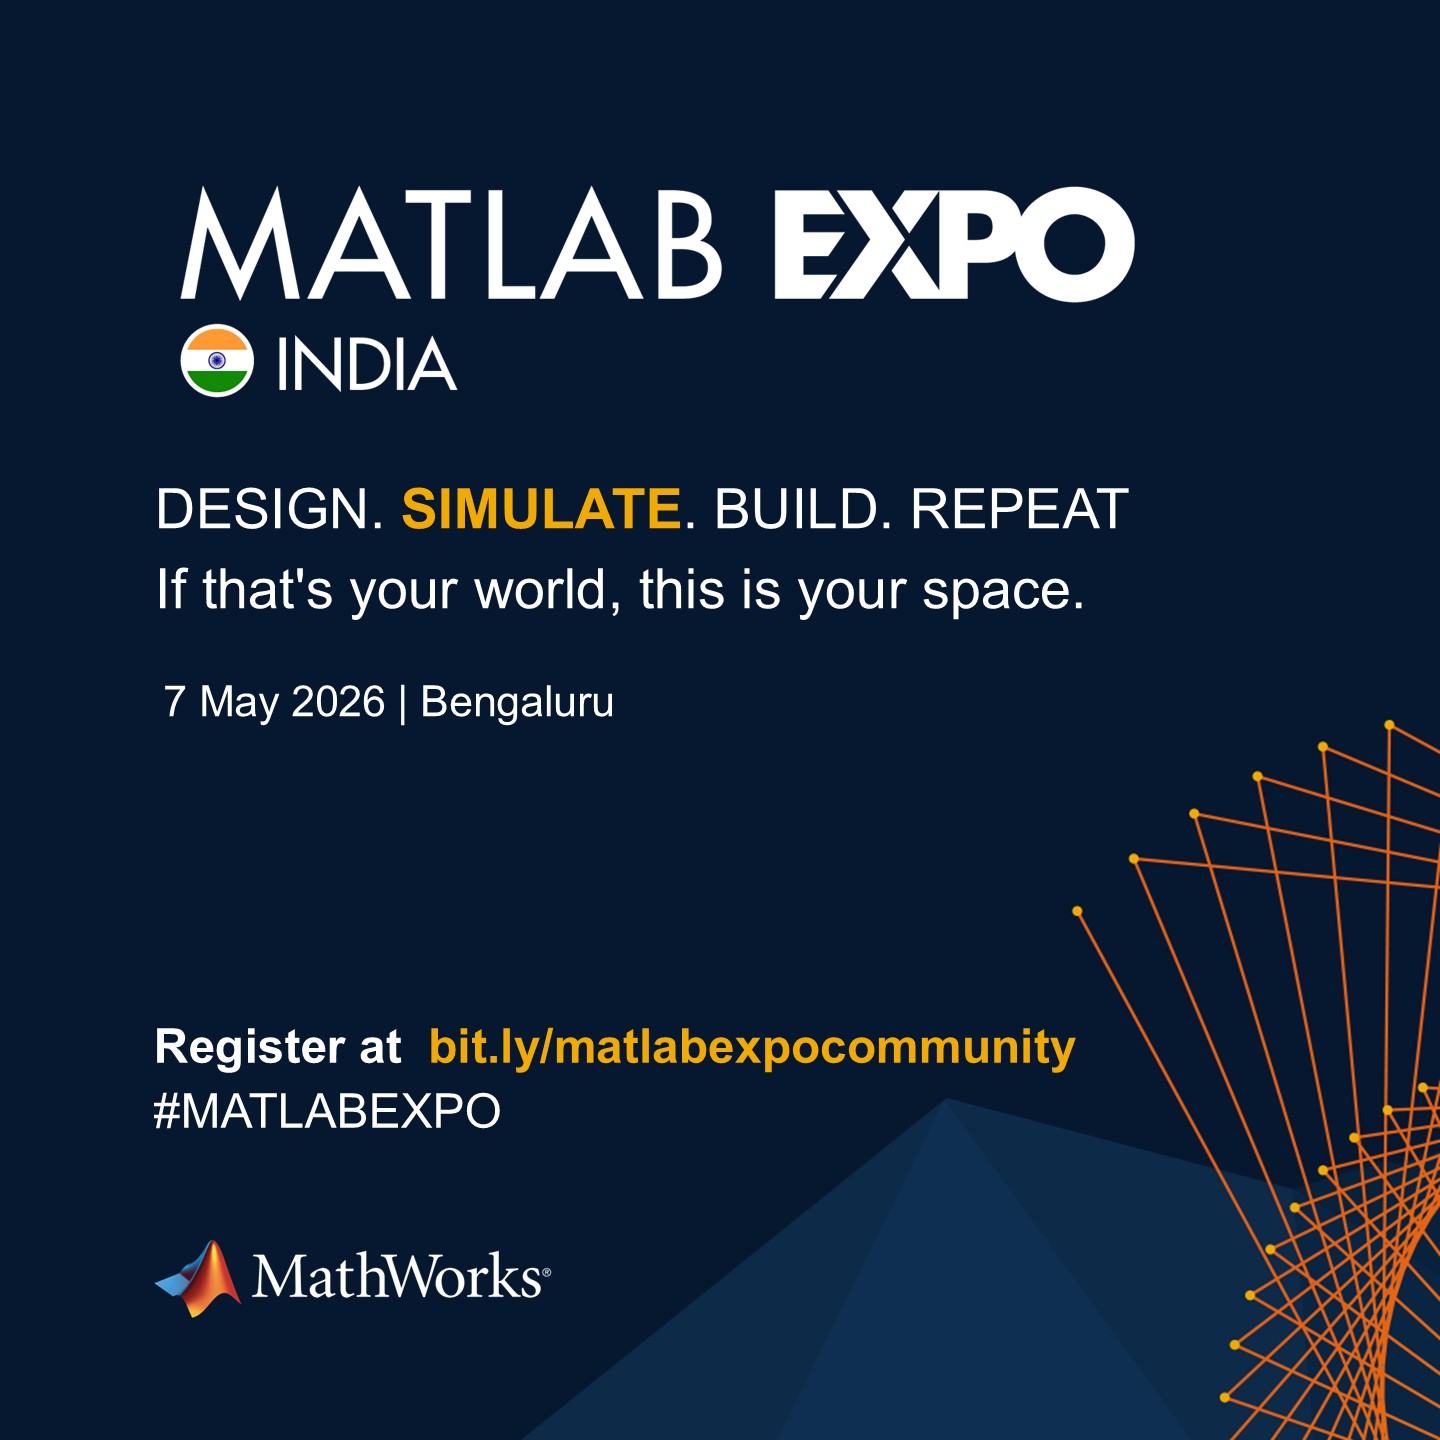
MATLAB EXPO India | 7 May | Bengaluru
Get inspired by the latest trends and real-world customer success stories transforming industries. Learn from trusted experts across 4 tracks.
- AI & Autonomous Systems
- Electrification
- Systems & Software Engineering
- Radar, Wireless & HDL
Register at bit.ly/matlabexpocommunity

Digital Twin Development of PEARL Autonomous Surface System Thermal Management
The top session of the countdown showcases how the PEARL engineering team used a digital twin to solve real‑world thermal challenges in a solar‑powered autonomous marine platform operating in extreme environments. After thermal shutdown events in the field, the team built a model that predicts temperatures at multiple locations with ~1% accuracy, while balancing accuracy with model complexity.
Beyond the technology, this keynote delivers practical lessons for predictive modeling and digital twins that apply well beyond marine systems.
We hope you’ve enjoyed the Top 10 countdown series—and a big thank‑you to Olivier de Weck at Massachusetts Institute of Technology, for delivering such a compelling and insightful keynote.
🎥 If you missed it live, be sure to watch the recording to see why it earned the #1 spot at MATLAB EXPO 2026.

MATLAB EXPO India is Back!
This in-person events brings together engineers, scientists, and researchers to explore the latest trends in engineering and science, and discover new MATLAB and Simulink capabilities to apply to your work.
May 7, 2026 l Bengaluru
Register at bit.ly/matlabexpocommunity
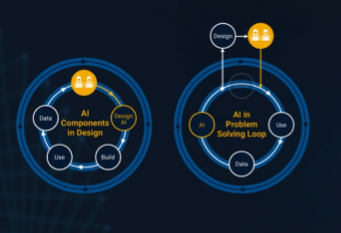
It’s no surprise this keynote landed at #2. MaryAnn Freeman, Senior Director of Engineering, AI, and Data Science explores how AI, especially generative AI, is transforming the way engineers design, build, and innovate. From accelerating the design loop with faster, data‑driven solutions, to blending human creativity with AI insights, to evolving engineering tools that turn ideas into build‑ready systems. This keynote shows how embedded intelligence helps engineers push past traditional limits and bridge imagination with real‑world impact.
If you’re curious about how AI is reshaping engineering workflows today (and what that means for the future of design), this is a must‑watch.
👉 Watch the keynote recording and see why it was one of the most popular sessions of MATLAB EXPO Online 2025.
Software‑defined vehicles are becoming reality—and this #3 ranked session shows how. In this keynote, Daniel Scurtu (NXP) demonstrates how MathWorks and NXP are working together to accelerate system‑level embedded development.
🔋 Using a vehicle electrification demo that runs across multiple NXP processors, you’ll see:
- Model‑Based Design workflows from concept to deployment
- Intelligent battery management and motor control
- Automatic code generation and hardware deployment
- ☁️ Real‑time cloud analytics and over‑the‑air updates
🛠️ Featuring MATLAB and Simulink products alongside NXP tools like Model-based Design Toolbox (MBDT), S32 Design Studio IDE, and Real-Time Drivers (RTD), this session highlights an end‑to‑end approach that reduces complexity and speeds the transition to software‑defined vehicles.
What’s New in MATLAB and Simulink in 2025
If you missed this session live, this is one of those “everyone’s talking about it” updates you’ll want to catch up on. 👀
This session is packed with the kinds of enhancements that quietly (and not so quietly) change how you work every day.
Here’s why it earned a spot in our Top 4:
- A redesigned MATLAB desktop with customizable sidebars and light/dark themes—built to adapt to how you work
- New side panels for coding and development tasks, plus more control over organizing and customizing figures
- MATLAB Copilot, a generative AI assistant optimized for MATLAB to help you explore ideas, learn techniques, and boost productivity directly in the desktop
- Simulink workflow improvements like a redesigned Simulink scope, more detailed info in quick insert, and automatic signal line straightening
- Enhanced Python integration across MATLAB and Simulink
- New AI deployment options optimized for Qualcomm and Infineon hardware targets
If staying current with MATLAB and Simulink is part of your role—or your edge—this session is a must‑watch. Missing it means missing context for features that will shape how you work in 2026 and beyond.
💬 Discussion topic:
Which single update from this release do you think will most improve your day‑to‑day workflow, and why?
🤖 What does it take to make robotic motion feel… human?
In this session, Tetsushi Sotowa shares how NSK is combining advanced control techniques with deep learning to enable human‑like grasping in electric grippers
You’ll see a real‑world case study featuring:
- Bilateral and force control systems developed in‑house
- MATLAB and Simulink–based control workflows
- Deep learning integration using Deep Learning Toolbox
- A practical path from mechatronics research to intelligent actuation
The result: an AI‑enhanced actuator capable of more natural, responsive grasping—bringing robotics one step closer to human motion.
👉 Interested in AI‑driven robotics and advanced control? Check out the session now from MATLAB EXPO 2025.
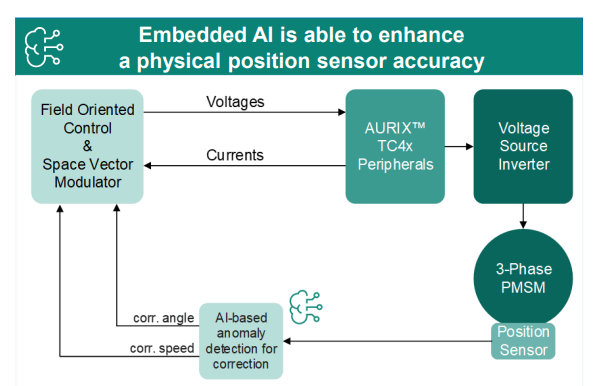
Missed a crowd‑favorite session feautring Marko Gecic at Infineon and Lucas Garcia at MathWorks?
This talk shows how to verify and test AI for real‑time, safety‑critical systems using an AI virtual sensor that estimates motor rotor position on an Infineon AURIX TC4x microcontroller. Built with MATLAB and Simulink, the demo covers training, verification, and real‑time control across a wide range of operating conditions.
You’ll see practical techniques to test robustness, measure sensitivity to input perturbations, and detect out‑of‑distribution behavior—critical steps for meeting standards like ISO 26262 and ISO 8800. The session also highlights how Model‑Based Design leverages AURIX TC4x features such as the PPU and CDSP to deploy AI with confidence.
Featuring: Dr. Arthur Clavière, Collins Aerospace
How can we be confident that a machine learning model will behave safely on data it’s never seen—especially in avionics? In this session, Dr. Arthur Clavière introduces a formal methods approach to verifying maching learning generalization. The talk highlights how formal verification can be apploied toneural networks in safety-critical avionics systems.
💬 Discussion question:
Where do you see formal verification having the biggest impact on deploying ML in safety‑critical systems—and what challenges still stand in the way?
Join the conversation below 👇
🚀 Unlock Smarter Control Design with AI
What if AI could help you design better controllers—faster and with confidence?
In this session, Naren Srivaths Raman and Arkadiy Turevskiy (MathWorks) show how control engineers are using MATLAB and Simulink to integrate AI into real-world control design and implementation.
You’ll see how AI is being applied to:
🧠 Advanced plant modeling using nonlinear system identification and reduced order modeling
📡 Virtual sensors and anomaly detection to estimate hard-to-measure signals
🎯 Datadriven control design, including nonlinear MPC with neural statespace models and reinforcement learning
⚡ Productivity gains with generative AI, powered by MATLAB Copilot
Hello All,
This is my first post here so I hope its in the right place,
I have built myself a GW consisting of a RAK2245 concentrator and a Raspberry Pi, Also an Arduino end device from this link https://tum-gis-sensor-nodes.readthedocs.io/en/latest/dragino_lora_arduino_shield/README.html
Both projects work fine and connect to TTN whereby packets of data from the end device can be seen in the TTN console.
I now want to create a Webhook in TTN for Thingspeak which would hopefull allow me to see Temperature , Humidity etc in graphical form.
My question, does thingspeak support homebuilt devices or is it focused on comercially built devices ?
I have spent many hours trying to find data hosting site that is comepletely free for a few devices and not to complicated to setup as some seem to be a nightmare. Thanks for any support .
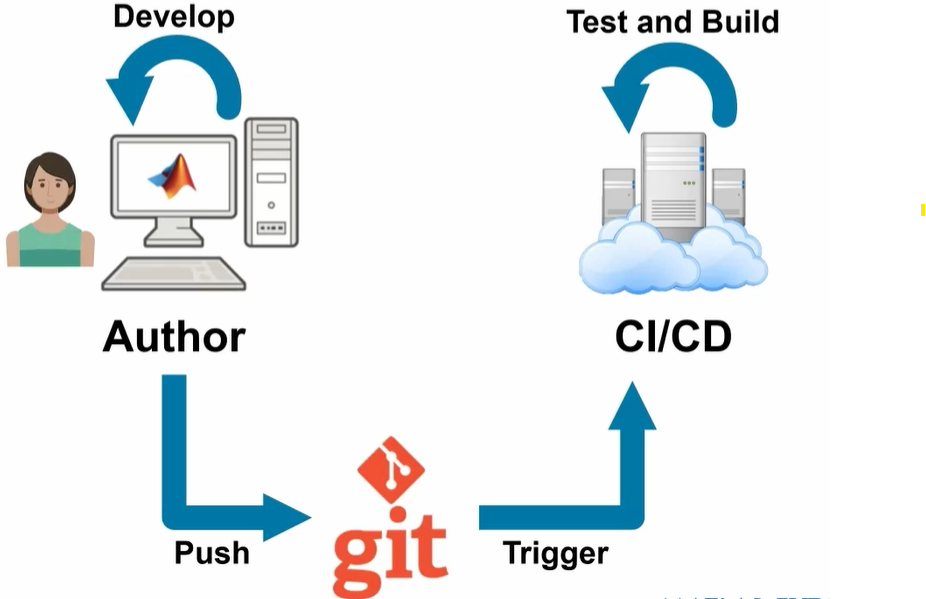
At #9 in our MATLAB EXPO 2025 countdown: From Tinkerer to Developer—A Journey in Modern Engineering Software Development
A big thank‑you to Greg Diehl at NAVAIR and Michelle Allard at MathWorks, the team behind this session, for sharing their multi‑year evolution from rapid‑fire experimenting to disciplined, scalable software development.
If you’ve ever wondered what it really takes to move MATLAB code from “it works!” to “it’s ready for production,” this talk captures that transition. The team highlights how improved testing practices, better structure, and close collaboration with MathWorks experts helped them mature their workflows and tackle challenges around maintainability and code quality.
Curious about the pivotal moments that helped them level up their engineering software practices?
How can I found my license I'd and password, so please provide me my id
Couldn’t catch everything at MATLAB EXPO 2025? You’re not alone. Across keynotes and track talks, there were too many gems for one sitting. For the next 9 weeks, we’ll reveal the "Top 10" sessions attended (workshops excluded)—one per week—so you can binge the best and compare notes with peers.
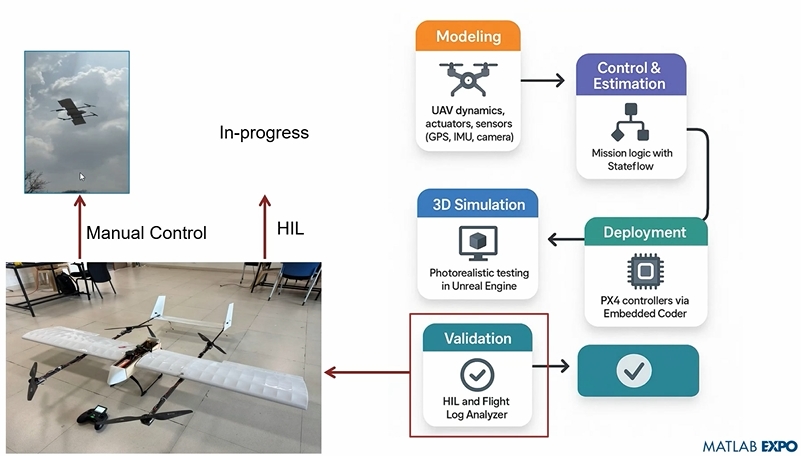
Starting at #10: Simulation-Driven Development of Autonomous UAVs Using MATLAB
A huge thanks to Dr. Shital S. Chiddarwar from Visvesvaraya National Institute of Technology Nagpur who delivered this presentation online at MATLAB EXPO 2025. Are you curious how this workflow accelerates development and boosts reliability?
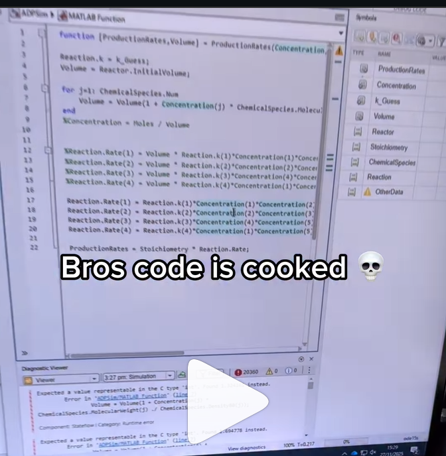
A coworker shared with me a hilarious Instagram post today. A brave bro posted a short video showing his MATLAB code… casually throwing 49,000 errors!
Surprisingly, the video went virial and recieved 250,000+ likes and 800+ comments. You really never know what the Instagram algorithm is thinking, but apparently “my code is absolutely cooked” is a universal developer experience 😂
Last note: Can someone please help this Bro fix his code?
Is it possible to display a variable value within the ThingSpeak plot area?